| Issue |
A&A
Volume 611, March 2018
|
|
|---|---|---|
| Article Number | A13 | |
| Number of page(s) | 12 | |
| Section | Stellar structure and evolution | |
| DOI | https://doi.org/10.1051/0004-6361/201731719 | |
| Published online | 14 March 2018 | |
Superhumps linked to X-ray emission
The superoutbursts of SSS J122221.7−311525 and GW Lib
1
Finnish Centre for Astronomy with ESO (FINCA), University of Turku,
Väisäläntie 20,
21500
Piikkiö, Finland
e-mail: This email address is being protected from spambots. You need JavaScript enabled to view it.
2
Astronomy Research Unit,
PO Box 3000,
90014
University of Oulu, Finland
3
Department of Physics & Astronomy, University of Leicester,
University Rd,
Leicester
LE1 7RH, UK
4
European Space Astronomy Centre (ESA/ESAC), Science Operations Department,
28691
Villanueva de la Cañada,
Madrid, Spain
5
School of Physics and Astronomy, University of Southampton,
Southampton
SO17 1BJ, UK
6
Department of Physics, University of Warwick,
Gibbet Hill Road,
Coventry
CV4 7AL, UK
7
Institut für Astronomie und Astrophysik, Universität Tübingen,
Sand 1,
72076
Tübingen, Germany
8
Kazan (Volga Region) Federal University,
Kremlevskaya str. 18,
kazan
420008, Russia
9
Instituto de Astronomía, Universidad Nacional Autónoma de México,
Apdo. Postal 877,
Ensenada,
22800
Baja California, Mexico
Received:
4
August
2017
Accepted:
10
December
2017
Abstract
Context. We present more than 4 years of Swift X-ray observations of the 2013 superoutburst, subsequent decline and quiescence of the WZ Sge-type dwarf nova SSS J122221.7−311525 (SSS J122222) from 6 days after discovery.
Aims. Only a handful of WZ Sge-type dwarf novae have been observed in X-rays, and until recently GW Lib was the only binary of this type with complete coverage of an X-ray light curve throughout a superoutburst. We collected extensive X-ray data of a second such system to understand the extent to which the unexpected properties of GW Lib are common to the WZ Sge class.
Methods. We collected 60 Swift-XRT observations of SSS J122222 between 2013 January 6 and 2013 July 1. Four follow-up observations were performed in 2014, 2015, 2016 and 2017. The total exposure time of our observations is 86.6 ks. We analysed the X-ray light curve and compared it with the behaviour of superhumps which were detected in the optical light curve. We also performed spectral analysis of the data. The results were compared with the properties of GW Lib, for which new X-ray observations were also obtained.
Results. SSS J122222 was variable and around five times brighter in 0.3–10 keV X-rays during the superoutburst than in quiescence, mainly because of a significant strengthening of a high-energy component of the X-ray spectrum. The post-outburst decline of the X-ray flux lasted at least 500 d. The data show no evidence of the expected optically thick boundary layer in the system during the outburst. SSS J122222 also exhibited a sudden X-ray flux change in the middle of the superoutburst, which occurred exactly at the time of the superhump stage transition. A similar X-ray behaviour was also detected in GW Lib.
Conclusions. We show that the X-ray flux exhibits changes at the times of changes in the superhump behaviour of both SSS J122222 and GW Lib. This result demonstrates a relationship between the outer disc and the white dwarf boundary layer for the first time, and suggests that models for accretion discs in high mass ratio accreting binaries are currently incomplete. The very long decline to X-ray quiescence is also in strong contrast to the expectation of low viscosity in the disc after outburst.
Key words: methods: observational / novae, cataclysmic variables / accretion, accretion disks / stars: dwarf novae / stars: individual: SSS J122221.7–311525 / stars: individual: GW Lib
© ESO 2018
1 Introduction
Accretion discs re-distribute angular momentum to allow stars and planets to form, and generate the vast amounts of energy which power active galactic nuclei and X-ray binaries. Accretion discs also play a major role in the overall behaviour of cataclysmic variables (CVs) – interacting binary systems in which accretion takes place onto a white dwarf (WD) due to Roche lobe overflow of a low-mass donor (secondary) component (see review by Warner 1995).
Dwarf novae (DNe) are a subset of CVs with relatively low mass-transfer rates, which undergo outbursts of 2–8 mag which recur on time-scales of days to years. The outbursts are thought to reflect a thermal instability of discs which, for certain mass-transfer rates, can never achieve a stable thermal equilibrium (Meyer & Meyer-Hofmeister 1981). In these cases the disc is either cool and faint, and building up its mass, or it is hot and bright and losing mass to the WD. For a comprehensive review of the disc instability model (DIM) see Lasota (2001). A transition of the disc from the quiescent state to the bright state and back is not an instant process. The outburst starts at some point in the disc where the thermal instability first occurs and propagates through the disc in the form of a heating wave switching it from a low-viscosity to a high-viscosity regime. On the return to quiescence the cooling wave starts near the outer disc and propagates inward (on transition waves see Meyer 1984; Cannizzo 1993).
DNe of the SU UMa-type show two types of outbursts: normal outbursts and less frequent superoutbursts which have a slightly larger amplitude and a longer duration. A unique property of superoutbursts is the appearance of low-amplitude modulations with a period of a few percent longer than the orbital one. These modulations are called superhumps and are explained by a tidal instability of the accretion disc, which grows when the disc expands beyond the 3:1 resonance radius. This causes the disc to become quasi-elliptical and precess (Whitehurst 1988; Hirose & Osaki 1990).
CVs are well known X-ray emitters. The X-ray emission in non-magnetic CVs is believed to originate from regions very close to the WD surface (Nucita et al. 2009, 2011), usually associated with a boundary layer (BL) between the accretion disc and the WD (Patterson & Raymond 1985a). The accreting material here is decelerated from Keplerian to much lower velocities to settle on to the WD surface. This results in shock heating of the material which is thought to release about half of its accretion luminosity, mostly in the form of X-rays and EUV emission (for recent reviews, see e.g. Kuulkers et al. 2006; Mukai 2017). Though X-ray properties of different DNe are not always consistent, on the whole they can be characterized by suppression of the X-ray flux during an outburst, accompanied by the softening of the X-ray spectrum (see, e.g. Baskill et al. 2005; Collins & Wheatley 2010, and references therein). The evolution of the X-ray flux of DNe throughout their outburst cycle is thought to be due to changes in the mass accretion rate with which matter enters the BL, and the corresponding changes in physical conditions in the inner accretion disc. In quiescence, the mass accretion rate is low, the BL is optically thin and very hot and assumed to be a source of hard X-rays (Pringle & Savonije 1979). In outburst the mass accretion rate is sufficiently high to produce the optically thick BL, which should lead to a suppression of the hard X-ray component and a subsequent appearance of the strong EUV emission (Patterson & Raymond 1985a, b).
While this scenario may adequately explain the gross X-ray behaviour of the majority of DNe, there are still many open issues. For example, several DNe showed an increase of their X-ray luminosity during an outburst (U Gem – Swank et al. 1978; Mattei et al. 2000, WZ Sge – Wheatley & Mauche 2005, GW Lib – Byckling et al. 2009, V455 And – Senziani et al. 2008, ASASSN-15po – Maccarone 2015). Moreover, during outbursts these CVs showed the appearance (as in U Gem; Güver et al. 2006) or a significant strengthening of a high-energy component of the X-ray spectrum. In general, the nature of the hard X-ray emission during DN outbursts and in quiescence remains controversial (for a discussion, see Mukai 2017). In an attempt to explain some of these problems, a number of different models of the BL have been proposed (e.g. Narayan & Popham 1993; Medvedev & Menou 2002; Hertfelder et al. 2013), yet the BL structure is still poorly understood and even the existence of the BL was put in doubt (the “missing BL” problem – Ferland et al. 1982). A disruption of the inner disc was explained, e.g. by a weakly magnetized WD (Livio & Pringle 1992), evaporation of the inner disc via a coronal siphon flow (Meyer & Meyer-Hofmeister 1994), irradiation from the WD (King 1997).
Interestingly, most of the “problematic” DNe mentioned above (GW Lib, WZ Sge, V455 And, ASASSN-15po) belong to an extreme subgroup of the SU UMa-type DNe, called WZ Sge-type stars (Vican et al. 2011; Kuulkers et al. 2011; Matsui et al. 2009; Namekata et al. 2017; for a recent review of WZ Sge stars, see Kato 2015). Among the peculiar properties of these objects are the lack of normal outbursts, a very long duration of superoutbursts (up to a month and even longer), very large superoutburst amplitudes exceeding 6 mag, very long recurrence time between superoutbursts (years and decades), and very extended post-outburst declines. It seems that these objects are special because of the very low mass of the donor star, which supplies matter to the WD with a very low mass-transfer rate (Kato 2015). The properties of the WZ Sge-type stars pose a severe challenge to the DIM, which is currently unable to explain them (Lasota 2001).
Unfortunately, only a handful of WZ Sge-type DNe have been observed in X-rays, and, up to the date of the data presented in this paper, GW Lib was still the only DN of this type with complete coverage of an X-ray light curve throughout a superoutburst. On 2013 January 1, a new WZ Sge-type DN – SSS J122221.7−311525 (hereafter SSS J122222) – was discovered in outburst by the Catalina Real Time Survey (CRTS; Drake et al. 2013). Subsequently SSS J122222 was found to have a relatively bright X-ray counterpart (Kuulkers et al. 2013) and we therefore started an intensive campaign of ground and space-based monitoring. An analysis of UV–optical–NIR photometric and spectroscopic observations of SSS J122222 was presented by Neustroev et al. (2017a, hereinafter referred to as Paper I. We showed that the superoutburst with the total amplitude of ~7 mag had an unusual double structure and a long duration. The two segments of the superoutburst were separated by an ~5 mag and ~10 d dip. The second segment of the superoutburst had a duration of 33 d and it displayed an extended post-outburst decline lasting ~500 d. The optical light curve of SSS J122222 clearly showed superhumps from the very first time-resolved observations and until at least 420 d after the rapid fading from the superoutburst. As in all SU UMa stars, the period of superhumps changed slightly over time (see also Kato et al. 2013).
Here, we present the results of X-ray observations of SSS J122222, which we compare with the X-ray and optical observations of GW Lib (Byckling et al. 2009). The superoutburst of GW Lib in 2007 lasted ~26 d and its optical amplitude exceeded 8 mag (Kato et al. 2009; Vican et al. 2011). Our major result is the discovery of a temporal coincidence of changes in X-ray and superhump behaviour in both systems, thus linking the properties of the BL with the outer disc.
2 Observations and data reduction
The Swift X-ray satellite (Gehrels et al. 2004) started observing SSS J122222 on 2013 January 6, 5.8 days after the discovery announcement (Kuulkers et al. 2013). For each observation, data were collected using both the X-ray Telescope (XRT; Burrows et al. 2005) and the UV/Optical Telescope (UVOT; Roming et al. 2005). In this paper we mostly concentrate on the X-ray observations.
Following the initial exposure, observations were obtained approximately every 1–3 days until 2013 July 1, with occasional gaps in the schedule caused by high priority Swift observationsof other targets. A total of 60 observations were taken during this period. Follow-up observations were performed on 2014 June 26, 2015 January 16 and on 2016 April 17. A final dataset was collected on 2017 April 26. The total exposure time of our observations is 86.6 ks.
The data were processed and analysed using heasoft 6.16, together with the most recent version of the calibration files. All the XRT data were collected in Photon Counting mode, with the standard grade selection of 0–12 used for the data analysis. There was no evidence for pile-up at any time, so a circle of radius 20 pixels, decreasing to 10 pixels as the source faded (1 pixel = 2.36 arcsec), was used for extraction of the source counts. The background count rate was estimated from a source-free 60 pixel radius circle, offset from, but close to, SSS J122222. Table 1 gives details of the Swift XRT observations.
In this paper we also use archival and new Swift XRT observationsof GW Lib. The full description and reduction of data obtained in 2007, 2008 and 2009 is presented in Byckling et al. (2009). On 2017 June 28 we performed a new ~2 ks observation of GW Lib, and additional 39 observations were taken in 2017 August–September. Thus, a total of 40 observations with the total exposure time of 19.6 ks were obtained in 2017. Details of these observations are given in Table 2. They were reduced in the same manner as those of SSS J122222.
Details of the Swift observations of SSS J122222, including count rates.
Log of the Swift observations of GW Lib in quiescence in 2017.
3 X-ray light curve
Figure 1 (upper panel) shows the X-ray light curve of SSS J122222 containing all our X-ray observationstogether with the optical fluxes from Paper I. For consistency, in this paper we follow Paper I in defining time T in units of days since 2013 January 8. Thus, T = 0 corresponds to HJD 2 456 300.0. In these units, the first segment of the optical super outburst began before T = −22 and the temporary fading stage began on T ≈ −6; the object re brightened again on T = 3, reached the maximum on T = 7 and faded from the outburston T = 37. SSS J122222 then displayed an extended post-outburst decline and returned to quiescence on T ≈ 500 (for discussion of properties of the optical light curve, see Paper I.
The initial rise of the X-ray and optical flux was missed, and only the second segment of the superoutburst and following decline had dense coverage in both bands. The X-ray flux of SSS J122222 during the superoutburst plateau (T = 5–33) was about five times higher than in quiescence (T > 500): 0.064 ± 0.022 and 0.013 ± 0.002 counts s−1, respectively. The first X-ray observations of SSS J122222 were obtained in the middle of the temporary fading stage, just before the system reached the minimum optical light (T = −0.6); Swift-XRT detected a relatively bright X-ray source with a count-rate of 0.120 ± 0.006 counts s−1. On T = 1.4 the X-ray flux dropped to the level of about 0.08 counts s−1 and then to ~0.07 counts s−1 and remained nearly stable until T = 17, showing no response to the optical rise to the second segment of the superoutburst. Surprisingly, in the middle of the outburst the data show a “zigzag” – a strong X-ray peak followed by a drop – which cannot be attributed to any feature of the optical light curve: on T = 17 the count-rate increased sharply to 0.125 ± 0.012 counts s−1 and on T = 19 was found at 0.033 ± 0.005 counts s−1 (a 7 σ difference). During the rest of the optical outburst the X-ray flux showed a slow hump-like evolution around the average level of ~0.05 counts s−1. On T = 38.1, at the end of the rapid fading stage, the X-ray light curve exhibited another very strong peak: during a day the flux rose from 0.02 ± 0.01 to 0.18 ± 0.02 counts s−1 and then decreased, following the power-law trend which resembles that found for the optical flux.
In Paper I we found that the decline segment of the optical light curves is well described by a broken power law as a function of time, counted from T = 36.4, and a slope-break some 20 d later. Within the scatter of the data, there is no evidence for a broken power law in X-ray data (Fig. 2). Instead, between T ≈ 100–140 the data show a somewhat higher X-ray flux than expected from a power law with the best fit index − 0.41 ± 0.03 (the optical data show no such a deviation).
Despite significant flux changes, the hardness ratio (the ratio of counts in the energy bands 1.0–10 and 0.3–1.0 keV) basically remained constant at 1.96 ± 0.13 from beginning to end of the observations. However, the hardness ratio data possibly show hints of changes between different superoutburst stages (Table 3). The hardness ratio decline before T = 38 may be step-wise (as shown in Fig. 1, bottom panel) or a continuous decline, if the former then the hardness ratio difference between T = −1–17 and 19–37 is 0.97 ± 0.42, a 2.3 σ difference.
There is no evidence for sinusoidal modulation in the X-ray data collected, either during the main outburst alone or including the decline data. A light-curve was extracted in 5 s bins, and periodograms were calculated with 256 bins per interval. This placed a 99% upper limit of 27.6% on any sinusoidal modulation (this limit is defined as the amplitude over the mean) for periods between 10 and 640 s. Thus, the XRT period search does not provide strong constraints on whether or not the WD in SSS J122222 is magnetic given the relatively high modulation amplitude limit. For example, the signature of magnetically confined accretion is seen in the intermediate polar AE Aqr which shows an X-ray modulation of amplitude ~15% at the WD rotation period of 33 s (e.g. Mauche 2006).
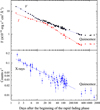 |
Fig. 2 Optical (top panel) and X-rays (bottom) light curves of the decline stage of the superoutburst of SSS J122222 plotted with a logarithmic time scale. The days are counted from the beginning of the rapid optical fading stage at T = 36.4. |
Values of the X-ray hardness ratio (1.0–10/0.3–1.0 keV) of SSS J122222, averaged over representative time intervals.
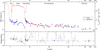 |
Fig. 1 Top: X-ray light curve of SSS J122222 in the energy range 0.3–10 keV shown together with the optical V -band light curve. T is the number of days elapsed since HJD 2 456 300.0. The optical fluxes are converted from 1-d averaged V magnitudes from Paper I. The left (X-rays) and right (optical) axes have the same relative ranges. Bottom: X-ray hardness ratio (1.0–10/0.3–1.0 keV) of SSS J122222. The values averaged over representative time ranges are shown by large diamonds. |
4 X-ray spectral analysis
The X-ray light-curve (Fig. 1) revealed a variable X-ray source. To investigate possible spectral evolution, seven spectra were extracted from the observations. The spectrum Sall consists of the complete set of XRT data. During the superoutburst stage the X-ray flux varied over a significantrange, roughly between 0.03 and 0.18 counts s−1. We therefore extracted two spectra for the outburst period. So,high consists of the data with the highest XRT count rates > 0.08 counts s−1; this covers intermittent intervals between T = −1–43. So,low, on the other hand, consists of the faintest outburst data (<0.08 counts s−1), obtained between T = 1–37. Bearing in mind that the hardness ratio data show a hint of a step-wise change at T ~ 18, we extracted two additional spectra, SA and SB, which cover intervals between T = −1–17 and 19–37, respectively (for the stages A and B of the superoutburst see Sect. 6.2). The last two spectra, Sd and Sq, consist of the data collected during the decline stage (T = 46–175) and after the system had reached the quiescent level (that is, the last four X-ray observations, T = 535, 738, 1196 and 1569). The spectra So,high, So,low, Sd and Sq are shown in Fig. 3 (left-hand panel).
All thespectra, except for Sq, were initially fitted with first one, then two, optically thin emission components (the apec model in xspec), absorbed by a variable column, NH. The Wilms solar abundances (Wilms et al. 2000) and Verner photoelectric absorption cross-sections (Verner et al. 1996) were assumed when fitting with the tbabs absorption model. The final spectrum, Sq, consists of only 121 counts; therefore, no attempt was made to fit these data with multiple emission components.
None ofthe spectra shows a significant difference in the primary apec temperature, with the emission being around 5–10 keV (see Table 4). Inclusion of a second optically thin emission model resulted in a better fit (99.4% confidence) only for the spectrum So,high, for which a temperatureof kT ~ 0.2 keV was derived.The fit to this spectrum was further improved when we replaced the cooler apec model with a blackbody model again having kT ~ 0.2 keV. We consider that these multi-component fits point to a multi-temperature emission spectrum, for which we do not have sufficient counts to derive a physically reasonable detailed description. In particular, we do not associate the fitted blackbody component with an optically thick BL due to its high temperature and low luminosity. The full set of fitted parameters is given in Table 4. The data and the best-fit model components for So,high and SB with residuals are plotted in Figure 3 (right-hand panel). In addition, we also extracted the spectrum from the 2017 observations of GW Lib. This spectrum SGW,q looks very similar to Sq, so we modelled it in a similar manner. The results are also given in Table 4.
If a BL between the accretion disc and the WD is present in this system, cool blackbody emission would be expected with kT ~ a few tens of eV and whose luminosity is expected to be comparable to the disc luminosity (Pringle & Savonije 1979; Popham & Narayan 1995; such a component was indeed observed in a few DNe, see e.g. Long et al. 1996; Mauche & Raymond 2000; Mauche 2004). Although the XRT is only sensitive down to energies of 0.3 keV, limits can be placed on the luminosity of such a soft X-ray blackbody. The So,high spectrum was used, with a single apec component to model the major component of the spectrum. A blackbody model was added at temperatures between 10 and 50 eV, with NH set to 1.6 × 10²⁰ and at 4.4 × 1020 cm−2 (limits taken from 90% confidence range for the best fit to the Sall spectrum as detailed in Table 4). Taking the distance to be 275 pc (Paper I, the 90% upper limit on the luminosity of a blackbody was thus estimated to be between ~1030 erg s−1 (for the hottest blackbody temperatures of ~50 eV) up to ~1037−38 erg s−1 (for a very low blackbody temperature of 10 eV). For a typical1 disc luminosity of a few × 1034 erg s−1, temperatures hotter than ~15 eV would imply only a small fraction of this luminosity is being emitted in an optically thick BL. At this luminosity the observed UVOT uvm2 magnitude of 10–11 would be exceeded by a blackbody BL cooler than kT ~ 15 eV. Thus, although we have not seen direct evidence of an optically thick BL, our data do not exclude a kT ~ 15 eV BL at the expected luminosity.
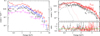 |
Fig. 3 Left: four X-ray spectra of SSS J122222 throughout the superoutburst. See text for detail. Right: upper panel: best-fit model components of the outburst spectrum SB and the brightest outburst spectrum So,high. The data are fitted with two optically-thin thermal emission components (shown by dashed and dotted lines), absorbed by a variable column density. Lower panel: residuals. |
Fits to the X-ray spectra described in the text.
5 Comparison with GW Lib
It is instructive to compare the most reliable X-ray properties of SSS J122222 with those of other WZ Sge-type stars. Unfortunately, of this class, only GW Lib has been observed in detail, allowing for a comparison. In contrast to SSS J122222, the optical light curve of GW Lib showed a rather usual pattern of superoutburst with no sign of a dip during the plateau stage (Fig. 4). However, the X-ray light curve displayed a strong peak2 around the time of the optical peak with an XRT count rate of ~5–6 counts s−1, after that the X-ray flux declined rapidly for ~10 days before stabilizing at an average level of 0.20 ± 0.04 counts s−1 during the remainder of the optical outburst. After a short deep dip and a bump observed immediately after the rapid fading from the outburst, the X-ray flux declined to the level of 0.10 ± 0.02 counts s−1. One and two years after the superoutburst, the X-ray flux was found to be ~0.03 ± 0.01 counts s−1 (for discussion of properties of the X-ray and optical light curves see Byckling et al. 2009; Vican et al. 2011, respectively). The most recent observations, taken in 2017, showed that the X-ray flux dropped further to the level of 0.016 ± 0.001 counts s−1. We point out, however, that 2 years before the superoutburst the X-ray flux of GW Lib was about five times below the 2017 level (Hilton et al. 2007). Thus, 10 years after the superoutburst, the object has not yet returned to its pre-outburst level. In contrast to GW Lib, the observed quiescent X-ray flux of the prototype system WZ Sge showed similar values before and 10 years after its most recent 2001 superoutburst (Nucita et al. 2014).
It is particularly interesting that in GW Lib the hardness ratio gradually increased during the superoutburst plateau from ~1 to ~2 (Byckling et al. 2009), whereas SSS J122222 rather showed a gradual decrease of the hardness ratio from ~2.5 to ~1. In quiescence the hardness ratio is nearly the same in both objects: 1.97 in GW Lib and 1.71 ± 0.62 in SSS J122222, and their spectra are statistically indistinguishable. We note that in the very beginning of the superoutburst, the GW Lib spectrum showed a strong very soft X-ray emission component consistent with an optically thick BL, which turned out to be undetectable in later observations(Byckling et al. 2009). In SSS J122222 no supersoft component was ever seen, and the hardness ratio evolution in this object was probably because of changes in contributionof hard and softer spectral optically thin components.
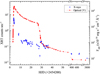 |
Fig. 4 X-ray light curve of GW Lib in the energy range 0.3–10 keV shown together with the optical V -band light curve. The optical fluxes are converted from 1d averaged V magnitudes from Kato et al. (2009) and the American Associationof Variable Star Observers (AAVSO) data base. The left (X-rays) and right (optical) axes have the same relative ranges. |
6 On thelong and short-term variability of the X-ray emission
The X-ray light curve of SSS J122222 shows two substantial short-term flux changes during the superoutburst stage: (1) the notable zigzag in the middle of the plateau stage, which had no counterpart in either optical or UV light curves; (2) the very strong spike observed immediately after the rapid fading. Another unusual property of SSS J122222 was an extended post-outburst decline of the X-ray flux. None of these features is common in DNe, we discuss them in the following subsections.
6.1 Transition of the accretion disc from optically thick to optically thin regimes
The appearance of the spike of X-ray emission after the rapid fading from the superoutburst plateau of SSS J122222 (T ≈ 38) is not completely unique. An increase of the X-ray flux after an outburst, in the form of a “bump”, was firstly reported forSS Cyg (Wheatley et al. 2003; McGowan et al. 2004)and later for GW Lib (Byckling et al. 2009). These bumps are usually attributed to the transition of the BL from optically thick to optically thin regimes. Schreiber et al. (2003) showed that an increased X-ray flux is expected at the onset of an every outburst when the mass accretion rate is rising and while the BL is still in an optically thin state, and at its end, when the mass accretion rate decreases below a critical value of the order of 1016 g s−1 and the BL transitions to its optically thin state. Surprisingly, however, a temporary increase at both the beginning and end of outbursts was observed previously only in SS Cyg andGW Lib (Wheatley et al. 2003; McGowan et al. 2004; Byckling et al. 2009).
Although we have no direct spectral evidence that the X-ray peak at the end of the superoutburst of SSS J122222 is due to the optically thick/thin state transition, variations of the hardness ratio show a hint of spectral hardening immediately after the outburst, supporting this interpretation (Fig. 1). It encouraged us to attempt to measure the critical mass accretion rate Ṁcr of the BL transitioning to its optically thin state. Following Fertig et al. (2011), we assume that the highest luminosity observed in the beginning of the decline corresponds to Ṁcr. We derived this luminosity using the observation obtained on T = 38.122 (count rate 0.18 ± 0.02). For a double apec model all the parameters were frozen at the values listed in Table 4 for the So,high spectrum and only the normalization was left to vary. We obtained the luminosity in the 0.3–10 keV energy range to be 4.82 × 1031 erg s−1, and the bolometric luminosity L = 9.32 × 1031 erg s−1. We then converted L to the mass accretion rate using Ṁ = 2si193LRwd/GMwd, where we adopted Mwd = 0.9 M⊙ and Rwd = 6.0 × 108 cm (Paper I. As a result, we found Ṁcr = 9.4 × 10¹⁴ g s−1. This value is much lower than the theoretical values (Popham & Narayan 1995), but is in agreement with Fertig et al. (2011), who also derived Ṁcr for six DNe and came to the same conclusion. In this respect, we note that the results of calculations of Popham & Narayan (1995) are questionable because they underestimated the Rosseland “true” opacity by at least two orders of magnitude (Suleimanov et al. 2014). The use of a more realistic coefficient will decrease the value of Ṁcr.
6.2 The X-ray zigzag in the middle of an outburst – a sign of an accretion disc transformation
As described above, the X-ray emission of non-magnetic CVs is believed to arise from close to the WD and thus reflects the physical conditions in the innermost parts of the accretion disc. A change of these conditions during a quiescence-outburst-quiescence cycle should lead to an increase or a depression of the X-ray flux. This scenario, however, fails to give an explanation of the X-ray zigzag in the middle of the superoutburst of SSS J122222. Indeed, in the middle of the outburst the accretion disc is in an almost steady state, the mass accretion rate is persistently high and the BL is optically thick. Under these conditions no significant variations in X-ray flux are expected.
In this respect, we point out that during the superoutbursts the accretion disc structure might be more complex than that predicted by the standard disc theory. Indeed, it is known that although the optical light curves of SSS J122222 and other SU UMa-type stars during the plateau stage of superoutbursts are very smooth, their accretion discs experience structural changes. An extensive study of superhumps showed (see Kato et al. 2009, and their later papers) that the evolution of superhump periods in most of SU UMa systems is composed of three distinct stages (A, B, and C in Kato et al. 2009). Kato et al. (2009) pointed out that the transitions between the stages are usually fast and abrupt, with discontinuous period changes, suggesting that these transitions occur due to geometrical and dynamical transformations in the accretion disc. As a textbook example of such an evolution, Figure 5 (upper right-hand panel) shows the O–C diagram of GW Lib, in which these three stages were observed during the 2007 superoutburst.
Although the superhump period in SSS J122222 evolved rather differently from other SU UMa DNe (for a discussion of possible causes, see Kato et al. 2013), nevertheless its O–C diagram (Fig. 5, left-hand panel) also shows three distinct segments. Surprisingly, by comparing the O–C diagram with the X-ray light curve, one can clearly see that the X-ray zigzag in the middle of the superoutburst occurred during the transition from stage A to stage B. Moreover, the hardness ratio variations also show a hint of spectral softening just after the zigzag (Fig. 1). It is also particularly interesting that the colour profiles of superhumps, which were observed during these three stages of superhump evolution, were notably different (Paper I). With such a notable X-ray response, it is tempting to speculatethat the accretion disc transformation may involve the entire disc, from the outer regions where the superhump light arises down to regions which produce X-rays.
If this was not just a coincidence, then one can expect to observe similar X-ray signatures of the superoutburst stage transitions in other SU UMa-type systems. The only other SU UMa-type CV whose superoutburst was observed in detail in both the X-rays and in the optical bands and whose superhumps were studied for period variations is GW Lib (Byckling et al. 2009; Kato et al. 2009; Vican et al. 2011). A comparison of its O–C diagram with the X-ray and optical light curves (Fig. 5, right-hand panel) shows several interesting features. First, the stabilizing of the X-ray flux after the initial rise and the following rapid decline has occurred simultaneously with the first appearance of superhumpsabout 10 days after the beginning of the superoutburst. This so-called superhump delay is explained as the growth time of the tidal instability in the accretion disc (Lubow 1991). The rapid decline of the X-ray flux observed during the first 10 d of the superoutburst indicates that while an eccentric disc was developing due to the tidal instability, the efficiency of an X-ray production was progressively decreasing. Secondly, during stage A the X-ray flux was very stable (and probably a bit higher than at the end of the initial rapid decline), but at the time of the stage A–B transition the flux began declining again and in 1–2 days dropped notably (>30%) to lower values. Thus, although the case of GW Lib is not as striking as in SSS J122222, it also supports our hypothesis that the transitions between the superoutburst stages are due to transformations in the entire accretion disc.
This conclusion is not obvious from prior theory and observations. It is widely accepted that particle orbits in the inner accretion disc are approximately circular and that the tidal influence of the secondary becomes significant only in the outer disc, where the tidal dissipation dominates the viscous shear dissipation (Murray 1998). As discussed by Osaki & Meyer (2003), the tidal dissipation of superhumps occurs in the outer 10 percent of the disc. However, Osaki & Kato (2013) proposed that the decrease of the superhump period during the stage A–B transition can be understood as being due to the propagation of the eccentricity wave to the inner part of the disc. As a result, the overall precession rate of the disc will be determined by its larger portion. Although Osaki & Kato (2013) admitted that their interpretation is still a matter of speculation, our results indicate that the changes in the disc structure during the superoutburst stage transitions penetrate deeply into the inner, X-ray emitting, regions.
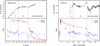 |
Fig. 5 O–C diagrams (upper panels) and optical and X-ray light curves (bottom panels, arbitrary scaling to emphasise the change in flux) of SSS J122222 (left-hand panel) and GW Lib (right-hand panel). The O–C diagram of SSS J122222 is taken from Paper I. To create the O–C diagram of GW Lib, we used the timings of superhump maxima from Table 152 in Kato et al. (2009). The stages of the superhump evolution are marked following Kato et al. (2013) and Kato et al. (2009). |
6.3 Post-outburst decline
The long-lasting post-outburst decline of the X-ray flux, which was exhibited by SSS J122222, indicates strongly that the enhanced accretion onto the WD continued for several hundred days after the rapid fading stage. However, such an enhanced accretion is expected to last only from the initial rise to an outburst when the heating wave reaches the BL, to the time when the cooling wave does the same, transforming the whole disc into the cool, quiescent state. According to the DIM (Cannizzo 1993; Lasota 2001), the viscosity in the quiescent accretion disc is low, especially in WZ Sge-type stars (Smak 1993; Lasota 2001), thus the viscous radial drift of matter is also very slow (Cannizzo 1993). Moreover, in the cool disc the mass accretion rate is expected to decrease steeply with decreasing radius (Ṁ ∝ r3 in such a disc, see e.g. Cannizzo 1993; Ludwig et al. 1994; Menou et al. 1999), thus almost no matter should reach the inner disc and the X-ray flux is expected to be low and stable. Nevertheless, despite the transition of the accretion disc of SSS J122222 to its quiescent state soon after the rapid fading stage (this is evident, e.g. from the replacement of the broad absorption troughs in the optical spectra by strong double-peaked emission lines, usually observed in quiescent accretion discs – Paper I, the X-ray flux declined for at least ~500 d, while the optical flux certainly declined continuously for ~500 d. Such long post-outburst declines are possibly a distinguishable property of the WZ Sge-type stars3, whereas ordinary SU UMa-type stars do not show them (see e.g. Osaki & Kato 2013).
It is particularly interesting that although X-rays and the optical flux predominantly originate at different sites – X-rays close to the WD, whereas the optical flux comes from the outer parts of the disc – their post-superoutburst decline in SSS J122222 was quite similar (Fig. 2). In Figure 6 we show the optical/X-ray flux diagram which includes all the post-superoutburst data and some representative data-points from the rise and late plateau stages. The most prominent features of this diagram are
-
1.
A nearly linear dependence between the X-ray and optical fluxes during the post-superoutburst decline.
-
2.
The dynamic range of the X-ray flux in the post-outburst decline is less than that of the optical flux
 where F are the maximal and minimal X-ray and optical fluxes.
 -
3.
The fitted line in the optical/X-ray flux diagram crosses the zero optical flux axis with a non-zero X-ray flux. This indicates that the dependence between the X-ray and optical fluxes must steepen significantly toward very low fluxes and accordingly very low mass accretion rates. This hypothesis is confirmed by the observations in quiescence, during which the X-ray flux is found to be significantly lower than that expected from the linear fit.
It is interesting to note that features (2) and (3) resemble strongly the behaviour of two outbursting, short orbital-period intermediate polars CC Scl and FS Aur in both outbursts4 and in quiescence (Neustroev et al. 2017b). In particular, the ratio of the outburst amplitudes R in X-rays and in the optical is also close to 0.6 in both objects.
A lineardependence between the X-ray and optical fluxes during the return to quiescence indicates that matter did not pile up in the outer disc, as expected in low-viscosity quiescent discs, but still drifted toward the WD relatively freely through the entire disc, more resembling the behaviour of a high-viscosity steady-state disc.
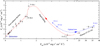 |
Fig. 6 Optical/X-ray flux diagram showing the post-superoutburst data and some representative data-points from the optical rise (shown in blue) and late plateau stages of SSS J122222. The dashed lines show the assumed trends of flux changes during the optical rise (blue) and rapid fading (red). The red short-dashed line shows the linear fit to the data from the post-outburst decline stage. The brightest X-ray data-point (T = 38.1) and the quiescence fluxes are seen to lie off the linear dependence. |
7 Possible scenarios explaining the raised viscosity of a post-superoutburst disc
There is no easy explanation as to why the viscosity remained elevated during the long post-outburst decline to quiescence, when the disc has already cooled down below the critical temperature, associated with the lower bend in the S-curve5, and why the viscosity finally switched to a low value, allowing SSS J122222 and other WZ Sge-type stars to reach quiescence. A possible mechanism is the heating of the inner disc by the hot WD. Such a scenario has originally been proposed by King (1997) in order to solve the so-called UV delay problem.
King (1997) showed that a WD with an effective temperature high enough (a few ×104 K) should heat the inner disc up to the transition radius Rtr of a few ×Rwd and maintain it in the hot, high viscosity state. King (1997) argued that at the end of an outburst the cooling wave cannot propagate within Rtr, where the disc remains hot and matter accretes to the WD much faster than at the cool region outside Rtr, resulting thus in a very low surface density of the inner disc. In this respect we note that although the inner hot flow structure and the exact mechanism of X-ray production in this model are still uncertain, the emitted X-ray flux should be proportional to the mass accretion rate at the radius Rtr, which in turn depends on the temperature of the WD: the hotter WD is, the higher X-ray flux is expected. An important baseline for our discussion is that the WD temperature in DNe is not constant, but is increasing during outbursts up to about 30 000 K and then slowly decreasing in quiescence (Sion 1995; Gänsicke & Beuermann 1996). The latter should result in shrinking Rtrand accordingly in decreasing the X-ray flux.
The WD heating during outbursts is primarily compressional heating by the additional amount of mass added on the WD envelope. The thermal response of a WD to compressional heating has been widely studied in the literature. From a theoretical point of view, the longer the outburst, the more mass is added to the envelope, the deeper the WD is heated and so the longer the post-outburst cooling (Sion 1995; Piro et al. 2005). This is confirmed by observations: the temperature decay time is indeed significantly longer after a superoutburst than after a normal outburst. In SU UMa-type stars, it is days after a normal outburst, weeks after a superoutburst (Gänsicke & Beuermann 1996; Long et al. 2009). For WZ Sge-type stars, the superoutbursts are much longer, they dump much more mass and the WD cooling times are years, 1–2 orders of magnitude longer than in ordinary SU UMa-type stars (Sion 1999; Godon et al. 2006; Toloza et al. 2016). These time-scales are consistent with those of post-outburst declines, and, qualitatively, the proposed scenario appears to be promising. Quantitatively, both the X-ray flux in GW Lib (Fig. 4) and its WD temperature (Bullock et al. 2011; Toloza et al. 2016; Szkody et al. 2016) are continuing to decline. This indicates that the transition radius Rtr has not yet reached the WD surface.
Unfortunately, the proposed scenario is incomplete in the sense that it fails to explain the extended post-outburst decline of the optical flux. The optical light originates beyond Rtr, where the disc is already cool and is not expected to cool down any more. Perhaps, it can be explained by strong boundary effects between the hot and cold parts of the disc. At the moment, it is still unclear how exactly the transition from an inner hot disc to an outer cold disc occurs. Stehle & King (1999) suggested that this transition region is extended and semistable. Another problem standing against the proposed model is that the long post-outburst declines were observed not only in the WZ Sge-type stars, but also in low mass X-ray binaries (LMXBs), in which the primary, accreting component is a neutron star or a black hole. For example, the black-hole candidate GRO J0422+32 after the main outburst in 1992 exhibited several rebrightenings and a long decay, similar in appearance to those observed in WZ Sge-type stars (Kuulkers 1998). Obviously, the WD heating cannot explain such a behaviour of a black-hole binary.
Attempting to find an adequate mechanism that is able to maintain the post-superoutburst disc viscosity higher than that at the pre-superoutburst level, when the system was in proper quiescence, we paid attention to the fact that many WZ Sge-type stars exhibit so called “late superhumps” for months following superoutbursts (Kato 2015). In SSS J122222 we traced superhumps through the complete decline stage until at least 420 d after the rapid fading, but were unable to detect them in quiescence (Paper I. We suspect that the disappearance of superhumps in quiescence is not just a coincidence, but instead the superhump disappearance stops the decline trend. In other words, we propose that an elliptical distortion of the disc can somehow stimulate a matter drift through the disc.
The exact mechanism responsible for this is not clear. Osaki et al. (1997) proposed that a temporal enhancement of viscosity in the quiescent disc could be produced by its highly turbulent state just after the superoutburst. They suggested that a possible cause of a strong turbulence in the disc after the superoutburst can be the tidal instability. Indeed, in Section 6.2 we presented evidence that the inner disc regions are probably under the influence of disc precession. Thus it is plausible that particles on quasi-elliptical orbits can penetrate the inner disc. The presence of a viscosity, even in an extreme case of WZ Sge-type systems, causes the orbits to intersect, leading to efficient gas heating and keeping thus the inner disc ina hot state with an increased viscosity. While the elliptical disc is slowly shrinking after the superoutburst, matter flow to the inner disc is also decreasing, resulting in gradual cooling. However, when the disc shrinks inside the 3:1 resonance radius, it suddenly returns to a near-circular form and finally reaches the quiescent state with a very low viscosity.
8 Summary and concluding remarks
We have analysed extensive X-ray observations of the WZ Sge-type DN SSS J122222 during its superoutburst in 2013, decline and subsequent quiescence. We collected 60 Swift-XRT observations of SSS J122222 between 2013 January 6 and 2013 July 1. Four follow-up observations were performed in 2014, 2015, 2016 and 2017. The total exposure time of our observations is 86.6 ks. The results obtained were compared with the properties of another WZ Sge-type DN, GW Lib, for which new X-ray observations were also obtained. Our primary findings can be summarised as follows:
-
1.
SSS J122222 showed a 5 times higher hard X-ray luminosity during its superoutburst than during its subsequent quiescence.
-
2.
We detected a sudden X-ray flux change in the middle of the superoutburst coincident with a change in superhump behaviour. A similar X-ray behaviour was also detected in GW Lib.
-
3.
The post-outburst decline of the X-ray flux of SSS J122222 lasted for at least ~500 d, while the optical flux certainly declined continuously for ~500 d.
-
4.
We found no direct evidence of the expected optically thick BL in the system during the outburst. If it is present at L ~ 2 × 1034 erg s−1 then its blackbody temperature cannot be significantly different from kT ~ 15 eV.
-
5.
The rapid decline of the X-ray flux of GW Lib, which was observed during the first 10 days after the initial rise at the beginning of the superoutburst, ended exactly at the time of the first appearance of superhumps. This stage of the superoutburst of SSS J122222 was missed.
-
6.
New observations of GW Lib in 2017 showed a decrease of X-ray flux in comparison to that observed after the optical outburst eight and nine years before. However, 10 years after the superoutburst, the X-ray flux is still about five times larger than was measured before the superoutburst.
We have showed for the first time that the X-ray flux from two WZ Sge systems is linked to their simultaneous superhump behaviour, thus linking the inner disc properties to those of the outer (possible whole) disc. Indeed, superhumps are caused by the disc precession, and their appearance, evolution and stage transitions reflect geometrical and/or dynamical transformations of the asymmetrical disc. This result suggests that models for accretion discs in high mass ratio accreting binaries are currently incomplete. The very long decline to X-ray quiescence is also in strong contrast to the expectation of low viscosity in the disc after outburst. We propose that the disc precession is a cause of an enhanced viscosity and an increased temperature of the inner disc, stimulating thus a matter drift through the disc during the decline stage of superoutbursts. These unexpected findings can have important implications beyond CVs, for example to LMXBs, in which a precessing accretion disc can be formed during outbursts (Smith et al. 2007).
Acknowledgments
We are thankful to Neil Gehrels for the support showed us during this and other projects. May he rest in peace. We thank the Swift team for executing the observations. We thank Boris Gänsicke for useful discussion of the white dwarf cooling problem. We are thankful to the anonymous referee whose comments helped greatly to improve the paper. This research has made use of data obtained through the High Energy Astrophysics Science Archive Research Center Online Service, provided by the NASA/Goddard Space Flight Center. This work made use of data supplied by the UK Swift Science Data Centre at the University of Leicester. We acknowledge with thanks the variable star observations from the AAVSO International Database contributed by observers worldwide and used in this research. K.L.P., J.P.O. and A.P.B. acknowledge the support of the UK Space Agency. TRM is supported by the STFC under grant ST/L000733. The work was supported by the Deutsche Forschungs-Gemeinschaft (DFG) grant WE 1312/51-1 and the Russian Foundation for Basic Research grant 16-02-01145-a (V.F.S.). The work of V.F.S. was also funded by the subsidy allocated to Kazan Federal University for the state assignment in the sphere of scientific activities (3.9780.2017/8.9). S.V.Z. acknowledges PAPIIT grant IN-100617 for resources provided towards this research.
References
- Baskill, D. S., Wheatley, P. J., & Osborne, J. P. 2005, MNRAS, 357, 626 [NASA ADS] [CrossRef] [Google Scholar]
- Bullock, E., Szkody, P., Mukadam, A. S., et al. 2011, AJ, 141, 84 [NASA ADS] [CrossRef] [Google Scholar]
- Burrows, D. N., Hill, J. E., Nousek, J. A., et al. 2005, Space Sci. Rev., 120, 165 [NASA ADS] [CrossRef] [Google Scholar]
- Byckling, K., Osborne, J. P., Wheatley, P. J., et al. 2009, MNRAS, 399, 1576 [NASA ADS] [CrossRef] [Google Scholar]
- Cannizzo, J. K. 1993, The Limit Cycle Instability in Dwarf Nova Accretion Disks, ed. J. C. Wheeler (Singapore: World Scientific Publishing Co.), 6 [Google Scholar]
- Collins, D. J.,& Wheatley, P. J. 2010, MNRAS, 402, 1816 [NASA ADS] [CrossRef] [Google Scholar]
- Drake, A. J., Djorgovski, S. G., Mahabal, A. A., et al. 2013, ATel, 4699 [Google Scholar]
- Ferland, G. J., Pepper, G. H., Langer, S. H., et al. 1982, ApJ, 262, L53 [NASA ADS] [CrossRef] [Google Scholar]
- Fertig, D., Mukai, K., Nelson, T., & Cannizzo, J. K. 2011, PASP, 123, 1054 [NASA ADS] [CrossRef] [Google Scholar]
- Gänsicke, B. T., & Beuermann, K. 1996, A&A, 309, L47 [NASA ADS] [Google Scholar]
- Gehrels, N., Chincarini, G., Giommi, P., et al. 2004, ApJ, 611, 1005 [NASA ADS] [CrossRef] [Google Scholar]
- Godon, P., Sion, E. M., Cheng, F., et al. 2006, ApJ, 642, 1018 [NASA ADS] [CrossRef] [Google Scholar]
- Güver, T., Uluyaz"i", C., Özkan, M. T., & Gögüş, E. 2006, MNRAS, 372, 450 [NASA ADS] [CrossRef] [Google Scholar]
- Hertfelder, M., Kley, W., Suleimanov, V., & Werner, K. 2013, A&A, 560, A56 [NASA ADS] [CrossRef] [EDP Sciences] [Google Scholar]
- Hilton, E. J., Szkody, P., Mukadam, A., et al. 2007, AJ, 134, 1503 [NASA ADS] [CrossRef] [Google Scholar]
- Hirose, M., & Osaki, Y. 1990, PASJ, 42, 135 [NASA ADS] [Google Scholar]
- Kato, T. 2015, PASJ, 67, 108 [NASA ADS] [CrossRef] [Google Scholar]
- Kato, T., Imada, A., Uemura, M., et al. 2009, PASJ, 61, S395 [NASA ADS] [Google Scholar]
- Kato, T., Monard, B., Hambsch, F.-J., Kiyota, S., & Maehara, H. 2013, PASJ, 65, L11 [NASA ADS] [CrossRef] [Google Scholar]
- King, A. R. 1997, MNRAS, 288, L16 [NASA ADS] [CrossRef] [Google Scholar]
- Kuulkers, E. 1998, New Astron. Rev. , 42, 1 [Google Scholar]
- Kuulkers, E., Norton, A., Schwope, A., & Warner, B. 2006, in Compact Stellar X-ray Sources, eds. W. H. G. Lewin, & M. van der Klis (Cambridge, UK: Cambridge University Press), [Google Scholar]
- Kuulkers, E., Henden, A. A., Honeycutt, R. K., et al. 2011, A&A, 528, A152 [NASA ADS] [CrossRef] [EDP Sciences] [Google Scholar]
- Kuulkers, E., Page, K. L., Knigge, C., et al. 2013, ATel, 4716 [Google Scholar]
- Lasota, J.-P. 2001, New Astron. Rev. , 45, 449 [Google Scholar]
- Livio, M., & Pringle, J. E. 1992, MNRAS, 259, 23P [NASA ADS] [CrossRef] [Google Scholar]
- Long, K. S., Mauche, C. W., Raymond, J. C., Szkody, P., & Mattei, J. A. 1996, ApJ, 469, 841 [NASA ADS] [CrossRef] [Google Scholar]
- Long, K. S., Gänsicke, B. T., Knigge, C., Froning, C. S., & Monard, B. 2009, ApJ, 697, 1512 [Google Scholar]
- Lubow, S. H. 1991, ApJ, 381, 259 [NASA ADS] [CrossRef] [Google Scholar]
- Ludwig, K., Meyer-Hofmeister, E., & Ritter, H. 1994, A&A, 290, 473 [NASA ADS] [Google Scholar]
- Maccarone, T. J. 2015, ATel, 8056 [Google Scholar]
- Matsui, R., Uemura, M., Arai, A., et al. 2009, PASJ, 61, 1081 [NASA ADS] [CrossRef] [Google Scholar]
- Mattei, J. A., Mauche, C., & Wheatley, P. J. 2000, JAAVSO, 28, 160 [NASA ADS] [Google Scholar]
- Mauche, C. W. 2004, ApJ, 610, 422 [NASA ADS] [CrossRef] [Google Scholar]
- Mauche, C. W. 2006, MNRAS, 369, 1983 [NASA ADS] [CrossRef] [Google Scholar]
- Mauche, C. W., & Raymond, J. C. 2000, ApJ, 541, 924 [NASA ADS] [CrossRef] [Google Scholar]
- McGowan, K. E., Priedhorsky, W. C., & Trudolyubov, S. P. 2004, ApJ, 601, 1100 [NASA ADS] [CrossRef] [Google Scholar]
- Medvedev, M. V., & Menou, K. 2002, ApJ, 565, L39 [NASA ADS] [CrossRef] [Google Scholar]
- Menou, K., Esin, A. A., Narayan, R., et al. 1999, ApJ, 520, 276 [NASA ADS] [CrossRef] [Google Scholar]
- Meyer, F. 1984, A&A, 131, 303 [NASA ADS] [Google Scholar]
- Meyer, F., & Meyer-Hofmeister, E. 1981, A&A, 104, L10 [NASA ADS] [Google Scholar]
- Meyer, F., & Meyer-Hofmeister, E. 1994, A&A, 288, 175 [NASA ADS] [Google Scholar]
- Mukai, K. 2017, PASP, 129, 062001 [NASA ADS] [CrossRef] [Google Scholar]
- Murray, J. R. 1998, MNRAS, 297, 323 [NASA ADS] [CrossRef] [Google Scholar]
- Namekata, K., Isogai, K., Kato, T., et al. 2017, PASJ, 69, 2 [NASA ADS] [CrossRef] [Google Scholar]
- Narayan, R., & Popham, R. 1993, Nature, 362, 820 [NASA ADS] [CrossRef] [Google Scholar]
- Neustroev, V. V., Marsh, T. R., Zharikov, S. V., et al. 2017a, MNRAS, 467, 597 (Paper I) [NASA ADS] [Google Scholar]
- Neustroev, V. V., Tsygankov, S., Suleimanov, V., & Sjoberg, G. 2017b, in 20th European White Dwarf Workshop, eds. P.-E. Tremblay, B. Gaensicke, & T. Marsh, ASP Conf. Ser., 509, 501 [Google Scholar]
- Nucita, A. A., Maiolo, B. M. T., Carpano, S., et al. 2009, A&A, 504, 973 [NASA ADS] [CrossRef] [EDP Sciences] [Google Scholar]
- Nucita, A. A., Kuulkers, E., Maiolo, B. M. T., et al. 2011, A&A, 536, A75 [NASA ADS] [CrossRef] [EDP Sciences] [Google Scholar]
- Nucita, A. A., Kuulkers, E., De Paolis, F., et al. 2014, A&A, 566, A121 [NASA ADS] [CrossRef] [EDP Sciences] [Google Scholar]
- Osaki, Y., & Kato, T. 2013, PASJ, 65, 95 [NASA ADS] [CrossRef] [Google Scholar]
- Osaki, Y., & Meyer, F. 2003, A&A, 401, 325 [NASA ADS] [CrossRef] [EDP Sciences] [Google Scholar]
- Osaki, Y., Shimizu, S., & Tsugawa, M. 1997, PASJ, 49, L19 [NASA ADS] [CrossRef] [Google Scholar]
- Patterson, J., & Raymond, J. C. 1985a, ApJ, 292, 550 [NASA ADS] [CrossRef] [Google Scholar]
- Patterson, J., & Raymond, J. C. 1985b, ApJ, 292, 535 [NASA ADS] [CrossRef] [Google Scholar]
- Piro, A. L., Arras, P., & Bildsten, L. 2005, ApJ, 628, 401 [NASA ADS] [CrossRef] [Google Scholar]
- Popham, R., & Narayan, R. 1995, ApJ, 442, 337 [NASA ADS] [CrossRef] [Google Scholar]
- Pringle, J. E., & Savonije, G. J. 1979, MNRAS, 187, 777 [NASA ADS] [CrossRef] [Google Scholar]
- Roming, P. W. A., Kennedy, T. E., Mason, K. O., et al. 2005, Space Sci. Rev., 120, 95 [NASA ADS] [CrossRef] [Google Scholar]
- Schreiber, M. R., Hameury, J.-M., Lasota, J.-P.. 2003, A&A, 410, 239 [NASA ADS] [CrossRef] [EDP Sciences] [Google Scholar]
- Senziani, F., Skinner, G., & Jean, P. 2008, ATel, 1372 [Google Scholar]
- Sion, E. M. 1995, ApJ, 438, 876 [NASA ADS] [CrossRef] [Google Scholar]
- Sion, E. M. 1999, PASP, 111, 532 [NASA ADS] [CrossRef] [Google Scholar]
- Smak, J. 1993, Acta Astron., 43, 101 [NASA ADS] [Google Scholar]
- Smith, A. J., Haswell, C. A., Murray, J. R., Truss, M. R., & Foulkes, S. B. 2007, MNRAS, 378, 785 [NASA ADS] [CrossRef] [Google Scholar]
- Stehle, R., & King, A. R. 1999, MNRAS, 304, 698 [NASA ADS] [CrossRef] [Google Scholar]
- Suleimanov, V., Hertfelder, M., Werner, K., & Kley, W. 2014, A&A, 571, A55 [NASA ADS] [CrossRef] [EDP Sciences] [Google Scholar]
- Swank, J. H., Boldt, E. A., Holt, S. S., Rothschild, R. E., & Serlemitsos,P. J. 1978, ApJ, 226, L133 [NASA ADS] [CrossRef] [Google Scholar]
- Szkody, P., Mukadam, A. S., Gänsicke, B. T., et al. 2016, AJ, 152, 48 [NASA ADS] [CrossRef] [Google Scholar]
- Toloza, O., Gänsicke, B. T., Hermes, J. J., et al. 2016, MNRAS, 459, 3929 [NASA ADS] [CrossRef] [Google Scholar]
- Verner, D. A., Ferland, G. J., Korista, K. T., & Yakovlev, D. G. 1996, ApJ, 465, 487 [NASA ADS] [CrossRef] [Google Scholar]
- Vican, L., Patterson, J., Allen, W., et al. 2011, PASP, 123, 1156 [NASA ADS] [CrossRef] [Google Scholar]
- Warner, B. 1995, Cambridge Astrophysics Series, 28 [Google Scholar]
- Wheatley, P. J., Mauche, C. W., & Mattei, J. A. 2003, MNRAS, 345, 49 [NASA ADS] [CrossRef] [Google Scholar]
- Wheatley, P. J. & Mauche, C. W. 2005, in The Astrophysics of Cataclysmic Variables and Related Objects, eds. J.-M. Hameury, & J.-P. Lasota, ASP Conf. Ser., 330, 257 [Google Scholar]
- Whitehurst, R. 1988, MNRAS, 232, 35 [NASA ADS] [Google Scholar]
- Wilms, J., Allen, A., & McCray, R. 2000, ApJ, 542, 914 [NASA ADS] [CrossRef] [Google Scholar]
A preliminary modelling of the UV-optical spectral energy distribution of SSS J122222 during the superoutburst gives L = 2.4 × 1034 erg s−1.
If such a peak was also present in SSS J122222, we likely missed it.
Long optical declines are routinely observed in the WZ Sge-type stars (Kato 2015). As for the X-ray declines, besides SSS J122222 only two other WZ Sge-type stars were observed in X-rays at this stage – GW Lib and WZ Sge itself. Although those observations were sparse, both objects showed a significant decrease of the X-ray flux between the beginning of the post-superoutburst decline and the quiescent state (Byckling et al. 2009; Nucita et al. 2014, see also Fig. 4).
In intermediate polars (IPs) the accretion occurs onto the magnetic poles of the WD. Because there is no BL in such a system, the X-ray flux, even during an IP outburst, is not expected to be suppressed, as in most non-magnetic DNe, but to increase proportionally with the mass accretion rate onto the WD.
This is evident from optical photometry and spectroscopy: during a few days after the rapid fading from the superoutburst the brightness of SSS J122222 has dropped by ≳4 mag; the spectra obtained on T = 72 and later show very wide absorption troughs at the wings of the Balmer emission lines; these troughs are formed in the WD photosphere, indicating a very low accretion luminosity (see Sect. 4.1 in Paper I.
All Tables
Values of the X-ray hardness ratio (1.0–10/0.3–1.0 keV) of SSS J122222, averaged over representative time intervals.
All Figures
|
Fig. 2 Optical (top panel) and X-rays (bottom) light curves of the decline stage of the superoutburst of SSS J122222 plotted with a logarithmic time scale. The days are counted from the beginning of the rapid optical fading stage at T = 36.4. |
| In the text | |
|
Fig. 1 Top: X-ray light curve of SSS J122222 in the energy range 0.3–10 keV shown together with the optical V -band light curve. T is the number of days elapsed since HJD 2 456 300.0. The optical fluxes are converted from 1-d averaged V magnitudes from Paper I. The left (X-rays) and right (optical) axes have the same relative ranges. Bottom: X-ray hardness ratio (1.0–10/0.3–1.0 keV) of SSS J122222. The values averaged over representative time ranges are shown by large diamonds. |
| In the text | |
|
Fig. 3 Left: four X-ray spectra of SSS J122222 throughout the superoutburst. See text for detail. Right: upper panel: best-fit model components of the outburst spectrum SB and the brightest outburst spectrum So,high. The data are fitted with two optically-thin thermal emission components (shown by dashed and dotted lines), absorbed by a variable column density. Lower panel: residuals. |
| In the text | |
|
Fig. 4 X-ray light curve of GW Lib in the energy range 0.3–10 keV shown together with the optical V -band light curve. The optical fluxes are converted from 1d averaged V magnitudes from Kato et al. (2009) and the American Associationof Variable Star Observers (AAVSO) data base. The left (X-rays) and right (optical) axes have the same relative ranges. |
| In the text | |
|
Fig. 5 O–C diagrams (upper panels) and optical and X-ray light curves (bottom panels, arbitrary scaling to emphasise the change in flux) of SSS J122222 (left-hand panel) and GW Lib (right-hand panel). The O–C diagram of SSS J122222 is taken from Paper I. To create the O–C diagram of GW Lib, we used the timings of superhump maxima from Table 152 in Kato et al. (2009). The stages of the superhump evolution are marked following Kato et al. (2013) and Kato et al. (2009). |
| In the text | |
|
Fig. 6 Optical/X-ray flux diagram showing the post-superoutburst data and some representative data-points from the optical rise (shown in blue) and late plateau stages of SSS J122222. The dashed lines show the assumed trends of flux changes during the optical rise (blue) and rapid fading (red). The red short-dashed line shows the linear fit to the data from the post-outburst decline stage. The brightest X-ray data-point (T = 38.1) and the quiescence fluxes are seen to lie off the linear dependence. |
| In the text | |
Current usage metrics show cumulative count of Article Views (full-text article views including HTML views, PDF and ePub downloads, according to the available data) and Abstracts Views on Vision4Press platform.
Data correspond to usage on the plateform after 2015. The current usage metrics is available 48-96 hours after online publication and is updated daily on week days.
Initial download of the metrics may take a while.