Fig. 4
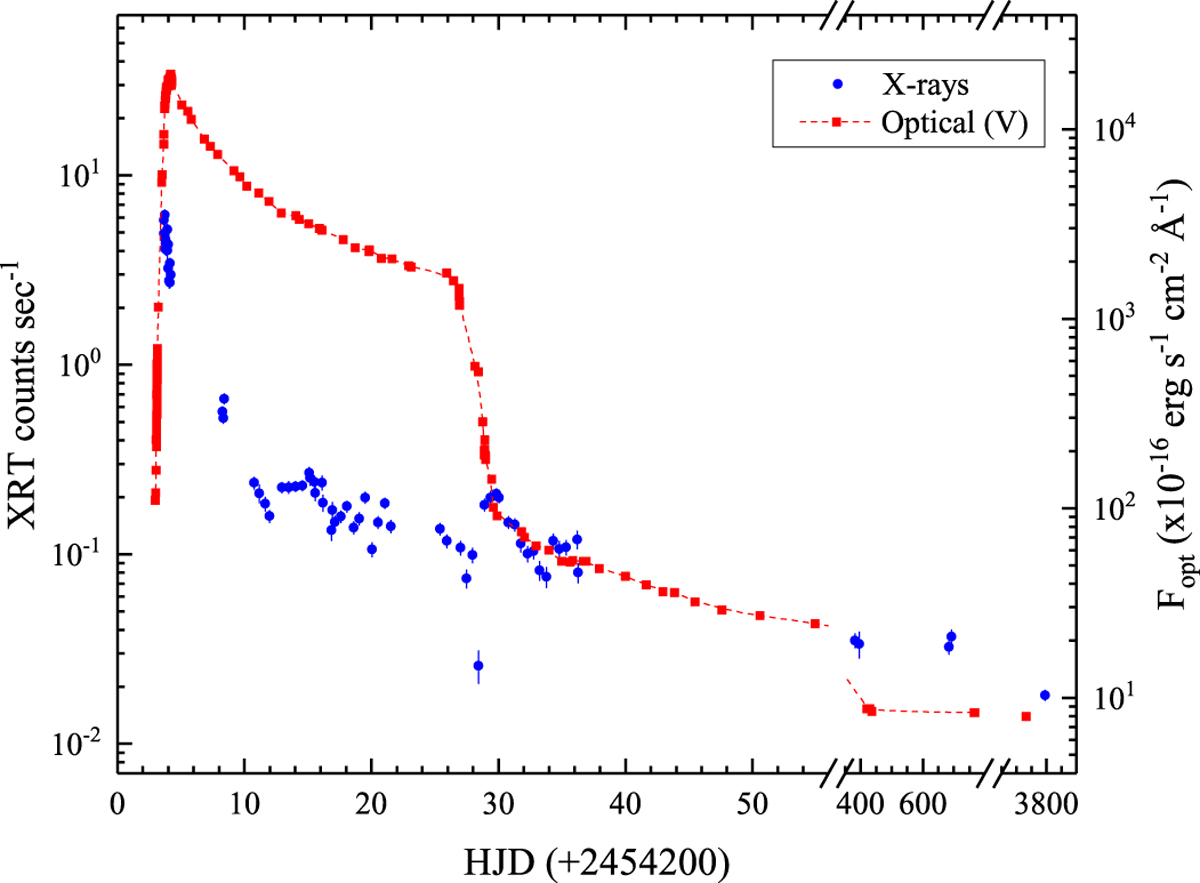
X-ray light curve of GW Lib in the energy range 0.3–10 keV shown together with the optical V -band light curve. The optical fluxes are converted from 1d averaged V magnitudes from Kato et al. (2009) and the American Associationof Variable Star Observers (AAVSO) data base. The left (X-rays) and right (optical) axes have the same relative ranges.
Current usage metrics show cumulative count of Article Views (full-text article views including HTML views, PDF and ePub downloads, according to the available data) and Abstracts Views on Vision4Press platform.
Data correspond to usage on the plateform after 2015. The current usage metrics is available 48-96 hours after online publication and is updated daily on week days.
Initial download of the metrics may take a while.