Fig. 6
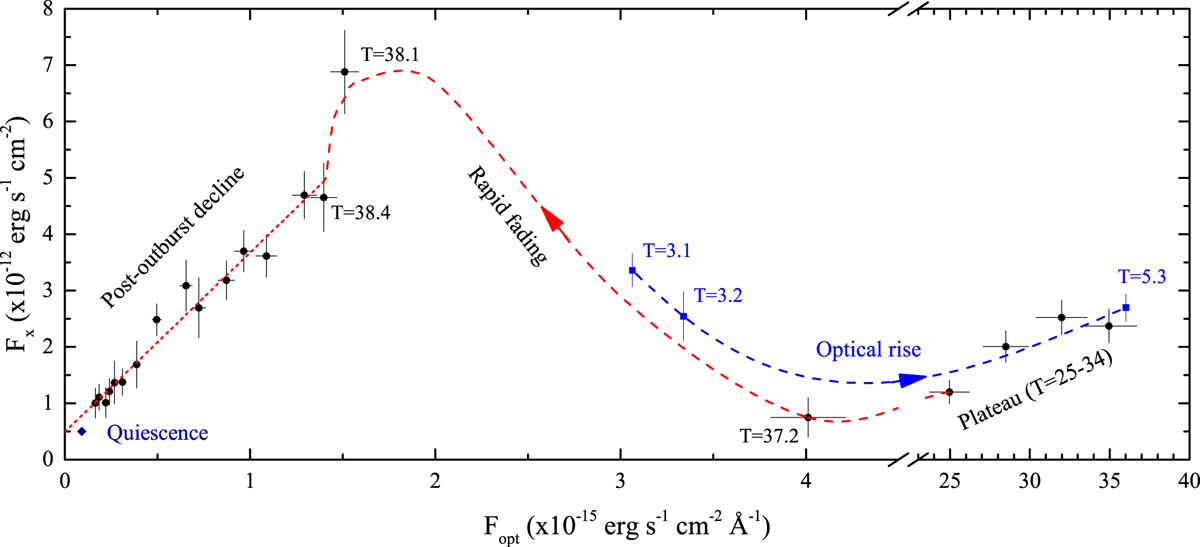
Optical/X-ray flux diagram showing the post-superoutburst data and some representative data-points from the optical rise (shown in blue) and late plateau stages of SSS J122222. The dashed lines show the assumed trends of flux changes during the optical rise (blue) and rapid fading (red). The red short-dashed line shows the linear fit to the data from the post-outburst decline stage. The brightest X-ray data-point (T = 38.1) and the quiescence fluxes are seen to lie off the linear dependence.
Current usage metrics show cumulative count of Article Views (full-text article views including HTML views, PDF and ePub downloads, according to the available data) and Abstracts Views on Vision4Press platform.
Data correspond to usage on the plateform after 2015. The current usage metrics is available 48-96 hours after online publication and is updated daily on week days.
Initial download of the metrics may take a while.