Fig. 3
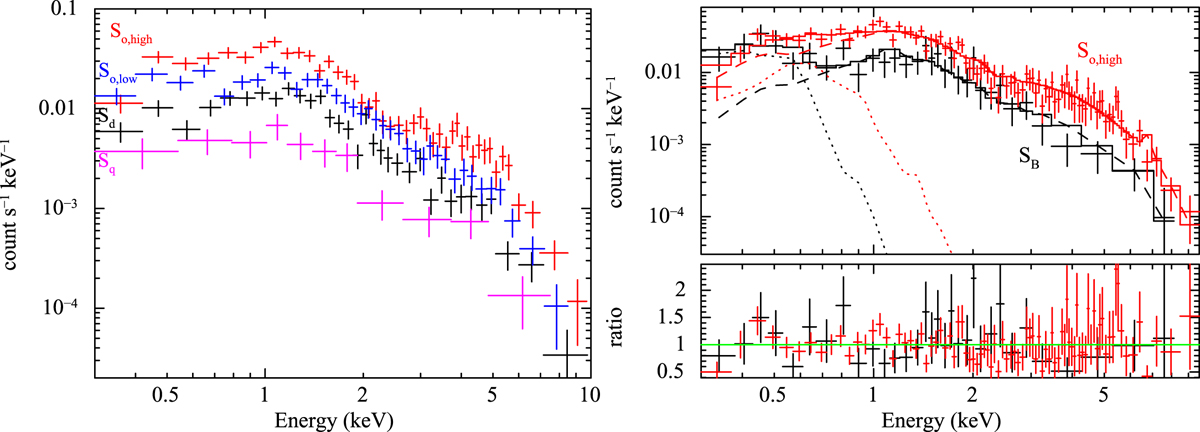
Left: four X-ray spectra of SSS J122222 throughout the superoutburst. See text for detail. Right: upper panel: best-fit model components of the outburst spectrum SB and the brightest outburst spectrum So,high. The data are fitted with two optically-thin thermal emission components (shown by dashed and dotted lines), absorbed by a variable column density. Lower panel: residuals.
Current usage metrics show cumulative count of Article Views (full-text article views including HTML views, PDF and ePub downloads, according to the available data) and Abstracts Views on Vision4Press platform.
Data correspond to usage on the plateform after 2015. The current usage metrics is available 48-96 hours after online publication and is updated daily on week days.
Initial download of the metrics may take a while.