Fig. 5
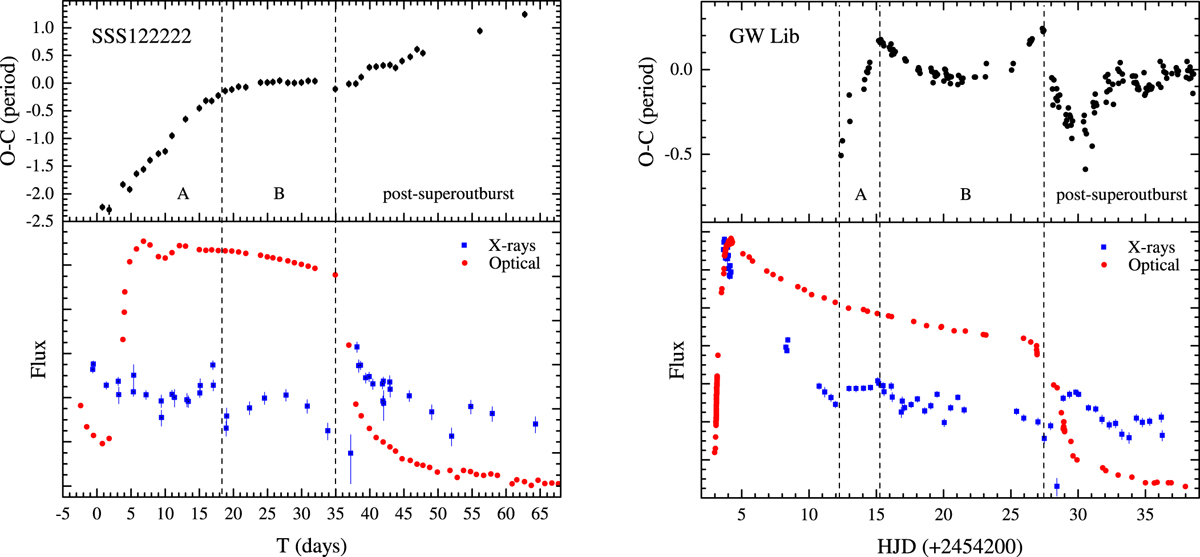
O–C diagrams (upper panels) and optical and X-ray light curves (bottom panels, arbitrary scaling to emphasise the change in flux) of SSS J122222 (left-hand panel) and GW Lib (right-hand panel). The O–C diagram of SSS J122222 is taken from Paper I. To create the O–C diagram of GW Lib, we used the timings of superhump maxima from Table 152 in Kato et al. (2009). The stages of the superhump evolution are marked following Kato et al. (2013) and Kato et al. (2009).
Current usage metrics show cumulative count of Article Views (full-text article views including HTML views, PDF and ePub downloads, according to the available data) and Abstracts Views on Vision4Press platform.
Data correspond to usage on the plateform after 2015. The current usage metrics is available 48-96 hours after online publication and is updated daily on week days.
Initial download of the metrics may take a while.