| Issue |
A&A
Volume 608, December 2017
|
|
|---|---|---|
| Article Number | A78 | |
| Number of page(s) | 12 | |
| Section | Interstellar and circumstellar matter | |
| DOI | https://doi.org/10.1051/0004-6361/201731058 | |
| Published online | 08 December 2017 | |
The wind and the magnetospheric accretion onto the T Tauri star S Coronae Australis at sub-au resolution
1 Max Planck Institute for Astronomy, Königstuhl 17, 69117 Heidelberg, Germany
e-mail: This email address is being protected from spambots. You need JavaScript enabled to view it.
2 Dublin Institute for Advanced Studies, 31 Fitzwilliam Place, D02 XF86 Dublin, Ireland
3 University Grenoble Alpes, CNRS, IPAG, 38000 Grenoble, France
e-mail: This email address is being protected from spambots. You need JavaScript enabled to view it.
4 I. Physikalisches Institut, Universität zu Köln, Zülpicher Str. 77, 50937 Köln, Germany
5 Universidade do Porto – Faculdade de Engenharia, Rua Dr. Roberto Frias, 4200-465 Porto, Portugal
6 CENTRA, Instituto Superior Tecnico, Av. Rovisco Pais, 1049-001 Lisboa, Portugal
7 European Southern Observatory, Karl-Schwarzschild-Straße 2, 85748 Garching, Germany
8 Max Planck Institute for Extraterrestrial Physics, Giessenbachstrasse, 85741 Garching bei München, Germany
9 LESIA, Observatoire de Paris, PSL Research University, CNRS, Sorbonne Universités, UPMC University Paris 06, University Paris Diderot, Sorbonne Paris Cité, 75005 Paris, France
10 European Southern Observatory, Casilla 19001, Santiago 19, Chile
11 Max-Planck-Institute for Radio Astronomy, Auf dem Hügel 69, 53121 Bonn, Germany
12 Department of Physics, Le Conte Hall, University of California, Berkeley, CA 94720, USA
13 Unidad Mixta Internacional Franco-Chilena de Astronomía (CNRS UMI 3386), Departamento de Astronomía, Universidad de Chile, Camino El Observatorio 1515, Las Condes, 1058 Santiago, Chile
14 Sterrewacht Leiden, Leiden University, Postbus 9513, 2300 RA Leiden, The Netherlands
Received: 27 April 2017
Accepted: 5 September 2017
Abstract
Aims. To investigate the inner regions of protoplanetary discs, we performed near-infrared interferometric observations of the classical T Tauri binary system S CrA.
Methods. We present the first VLTI-GRAVITY high spectral resolution (R ~ 4000) observations of a classical T Tauri binary, S CrA (composed of S CrA N and S CrA S and separated by ~1.̋4), combining the four 8m telescopes in dual-field mode.
Results. Our observations in the near-infrared K-band continuum reveal a disc around each binary component, with similar half-flux radii of about 0.1 au at d ~ 130 pc, inclinations (i = 28 ± 3° and i = 22 ± 6°), and position angles (PA = 0°± 6° and PA = –2°± 12°), suggesting that they formed from the fragmentation of a common disc. The S CrA N spectrum shows bright He i and Brγ line emission exhibiting inverse P Cygni profiles, typically associated with infalling gas. The continuum-compensated Brγ line visibilities of S CrA N show the presence of a compact Brγ emitting region whose radius is about ~0.06 au, which is twice as big as the truncation radius. This component is mostly tracing a wind. Moreover, a slight radius change between the blue- and red-shifted Brγ line components is marginally detected.
Conclusions. The presence of an inverse P Cygni profile in the He i and Brγ lines, along with the tentative detection of a slightly larger size of the blue-shifted Brγ line component, hint at the simultaneous presence of a wind and magnetospheric accretion in S CrA N.
Key words: stars: formation / circumstellar matter / ISM: jets and outflows / ISM: individual objects: S CrA / infrared: ISM / techniques: interferometric
GRAVITY is developed in a collaboration by the Max Planck Institute for Extraterrestrial Physics, LESIA of Paris Observatory and IPAG of Université Grenoble Alpes/CNRS, the Max Planck Institute for Astronomy, the University of Cologne, the Centro Multidisciplinar de Astrofisica Lisbon and Porto, and the European Southern Observatory.
© ESO, 2017
1. Introduction
The physical structure and processes acting in the inner regions of protoplanetary discs are still poorly constrained, yet they are key elements for understanding disc dynamics and evolution. In this region, accretion flows, winds, and outflows are essential in order to control angular momentum, alter the gas content, and drive the dynamics of the gas (see e.g. Alexander et al. 2014). While spectroscopic studies can bring some constraints to these processes, only spatially resolved observations with milliarcsecond (mas) resolution, that is, on sub-astronomical unit (au) scale for the nearest star forming regions, can discriminate between competing models.
In the past decade, near-infrared (NIR) interferometers have successfully resolved the inner regions of circumstellar discs around young stars. Detailed studies of individual objects were done through observations of the dust traced by the continuum emission (Tannirkulam et al. 2008; Benisty et al. 2010; Kraus et al. 2013) or of the hot and warm gas components through hydrogen recombination and CO vibrational lines (Tatulli et al. 2007; Eisner et al. 2007; Kraus et al. 2008). The first statistical analysis of the dust has recently been carried out with the advent of the four-telescope H-band instrument PIONIER at the Very Large Telescope Interferometer (VLTI). This survey showed that the sublimation front is in general rather smooth and wide, in agreement with the presence of multiple grain populations, and that its thickness is larger than predicted by hydrostatic models (Anthonioz et al. 2015; Lazareff et al. 2017).
However, observations of the gaseous disc component are more challenging and they have so far been restricted to a handful of bright and/or highly accreting sources (e.g. Kraus et al. 2008; Eisner et al. 2014; Garcia Lopez et al. 2015; Caratti o Garatti et al. 2015). In this context, the H i Brγ line has been the focus of most of the interferometric studies performed in the K band so far to trace the hot inner gas, and thus, the physical processes taking place within the inner disc region. These studies, mainly focused on Herbig stars, have shown that in most cases the Brγ line originates from a very compact region located well within the dust sublimation radius. Despite its small angular size (a few tenths of mas), most of the detailed individual studies associate the origin of this line with a wind or the hot layers of a circumstellar disc rather than with magnetospheric accretion (Weigelt et al. 2011; Ellerbroek et al. 2014; Mendigutía et al. 2015; Garcia Lopez et al. 2015, 2016; Caratti o Garatti et al. 2015). Results from these highly irradiated discs are, however, probably not representative of the bulk of the young stellar object (YSO) population, and in particular of the Classical T Tauri stars (CTTSs), which have much lower stellar temperatures than their higher mass counterparts, the Herbig Ae/Be stars. By modelling spatially and spectrally (R ~ 2000) resolved Brγ line profiles of CTTSs, Eisner et al. (2010) suggest that the H i gas mostly traces infalling columns of material, although some emission might also originate from compact regions of outflowing winds.
In this paper, we present the first interferometric observations of a CTTS obtained in the K band with GRAVITY, the second generation beam combiner at the VLTI (Eisenhauer et al. 2011; Gravity Collaboration et al. 2017), and a spectral resolution of R ~ 4000. We observed the binary system S CrA located at a distance of ~130 pc (Prato et al. 2003; Neuhäuser & Forbrich 2008), with a separation of ~1.̋4 and a PA of 157° (Reipurth & Zinnecker 1993; Prato et al. 2003). Both sources are CTTSs and they appear coeval (Prato et al. 2003; Petrov et al. 2014). Due to the high veiling measured in both objects, the spectral types are uncertain ranging from G to M (Prato et al. 2003; Carmona et al. 2007; Petrov et al. 2014). Both stars are strong accretors. They possess flared discs and a remnant envelope, as suggested by Herschel observations (Sicilia-Aguilar et al. 2013). The system is still very active and associated with HH 82 (PA ~ 95°) and HH 729 (PA ~ 115°, see Wang et al. 2004; Kumar et al. 2011; Peterson et al. 2011).
S CrA was classified early on as one of the brightest examples of the YY Ori objects, a class of pre-main sequence stars, first identified by Walker (1972). These objects show a broad red-shifted absorption component (inverse P Cygni profile) on the wings of selected emission lines, indicating infalling gas at velocities larger than 100 km s-1. Several detailed spectroscopic studies of the optical H i lines in S CrA are reported in the literature (see e.g. Bertout et al. 1982; Appenzeller et al. 1986; Krautter et al. 1990). In particular, Krautter et al. (1990) favour the model of magnetospheric accretion for the origin of these red-shifted absorption features.
We first describe the GRAVITY observations and data processing (Sect. 2), then the spectroscopic and interferometric results (Sect. 3). We interpret them using geometric models applied to the continuum and the Brγ line (Sect. 4). Finally, all findings are discussed in Sect. 5.
2. Observations and data reduction
Observation log of the VLTI/GRAVITY high-resolution (R ~ 4000) observations of S CrA North and South conducted with the UTs.
The binary system S CrA was observed in two runs (20 July and 16 August 2016, see Table 1) with the VLTI instrument GRAVITY, using the four 8 m Unit Telescopes (UTs) of the European Southern Observatory and recording interferograms on six baselines simultaneously. The observations were performed in dual-field mode swapping between the North (S CrA N) and South (S CrA S) components of the binary system. This allowed us to alternate each of the binary components on the fringe tracker (FT) and science (SC) detectors.
The visibilities and closure phases for the FT detector are recorded at low spectral resolving power (R ~ 23, e.g. five spectral channels over the K band) with the FT working at 1 kHz and allowing the atmospheric effects on the fringe patterns to be frozen. On the other hand, the SC detector was set at high spectral resolution (HR; R ~ 4000, i.e., a radial velocity (RV) resolution of ΔRV ~ 70 km s-1) in the combined polarization mode. More details about the GRAVITY instrument and observing modes can be found in Gravity Collaboration et al. (2017). A detailed log of the observations is presented in Table 1.
The data were reduced using the GRAVITY data reduction Software v0.9 (Lapeyrere et al. 2014). To calibrate the atmospheric transfer function the calibrators HD 188787 and HD 176047 were also observed with GRAVITY in single-field mode (Table 1) at the same airmass as the scientific target. To obtain the spectra of S CrA N and S CrA S, we performed an average of the HR spectrum recorded in each of the four photometric channels. The calibrators were also used as telluric standards after removing the intrinsic photospheric absorption features present in their spectra and dividing them by a black body at the appropriate temperature. The telluric corrected spectra of S CrA N and S CrA S were then flux calibrated assuming K-band magnitudes of 6.6 and 7.3, respectively (Prato et al. 2003). The wavelength calibration of the GRAVITY spectra was refined using the many telluric features present in the whole K band, obtaining an average shift of ~3 Å. The residual uncertainty is about 1–1.5 Å or ~14–20 km s-1.
The weather conditions in the August run were not optimal and thus the signal-to-noise ratio of the HR science observations was much worse than that of the July run. Therefore, while we can use all the FT low-resolution datasets to fit the continuum of each binary system component (Sect. 4.1), we can only use the July HR observations of S CrA N to model the Brγ line emitting region of this component (Sect. 4.2). The spectro-interferometric data for S CrA S around the Brγ line have a poor signal-to-noise ratio even in the July run and therefore they are only displayed in the Appendix and could not be examined further. Finally, even with the good-quality July dataset of S CrA N, we were not able to retrieve differential interferometric signals across the He i line (Sect. 3.1), because of its small line-to-continuum ratio ( <10%).
3. Results
VLTI-GRAVITY observations allow us to obtain the K-band spectra (from ~2.0 μm to ~2.5 μm), as well as six spectrally dispersed visibility amplitudes and differential phases, and three closure phase measurements.
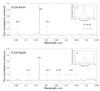 |
Fig. 1 GRAVITY observations of S CrA taken during the July campaign showing the spectra of S CrA North (top) and South (bottom). Insets display the velocity calibrated Brγ line profiles. |
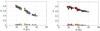 |
Fig. 2 Squared visibility (V2) vs. projected baseline in units of 106λ for four FT spectral channels from our GRAVITY+UT observations of S CrA North (left panel) and South (right panel). The data and best fitting model are represented by filled symbols and crosses, respectively. The absolute value of the fit residuals is shown at the bottom of each panel. Different colours indicate different spectral channels. |
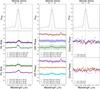 |
Fig. 3 GRAVITY+UT HR observations of S CrA N on 2016 July 20. The Brγ line profile normalised to the continuum is shown in the top row. The radial velocity is with respect to the LSR. Dashed lines represent smoothed data by two spectral channels. Left: wavelength-dispersed visibility amplitudes measured in the UT3-UT4, UT2-UT4, and UT1-UT4 (middle row), and the UT2-UT3, UT1-UT3, and UT1-UT2 (bottom row) baselines. Middle: same as left, but for the wavelength-dispersed differential-phase signals. For clarity, the differential phases of the first and last baselines have been shifted by +10° and –10°. Right: wavelength-dispersed closure phase signals for the triplets UT2-UT3-UT4 and UT1-UT3-UT4 (middle row), and UT1-UT2-UT4 and UT1-UT2-UT3 (bottom row). |
3.1. Spectrum of each component
The full K-band spectrum of S CrA N is shown in Fig. 1-top. It displays bright He i 2.06 μm and Brγ emission, as well as a faint Na i doublet (at 2.206 and 2.209 μm) and H i Pfund (24–20) emission lines. These lines are usually found in the spectra of actively accreting CTTSs. Interestingly, the line profile of the He i line and, marginally, that of the Brγ line show an inverse P Cygni line profile with the red-shifted absorption component at radial velocities of 400 ± 50 km s-1 and 300 ± 100 km s-1, respectively. This feature is usually associated with infalling gas located in magnetospheric accretion columns (Edwards et al. 2006; Kurosawa et al. 2011). Notably, the red-shifted absorption features of the H i Balmer lines were detected at 220–270 km s-1, extending out to 350–400 km s-1 (see Bertout et al. 1982; Krautter et al. 1990).
Moreover, the Brγ line displays a double-peaked asymmetric profile with radial velocities of ~0 km s-1 and ~–360 ± 40 km s-1, where the blue-shifted component is likely tracing a high-velocity jet or wind.
The K-band spectrum of S CrA S (Fig. 1-bottom) also exhibits a double-peaked and inverse P Cygni Brγ line and several photospheric absorption lines (Al I 2.110–2.117), NaI (2.207–2.209), CaI (2.226–2.227), and CO bandheads (2.29–2.4), indicative of a late-type star (K late or early M).
3.2. Continuum visibilities of both components
The dual-field mode swapping between the North and South components of the binary system allows us to measure and compare the continuum visibilities recorded with both FT and SC detectors. Good agreement at a level better than 5% was found between the calibrated continuum visibilities measured on the FT and SC detectors in July. Hereafter, we use the FT datasets to fit the continuum of both components (Sect. 4.1). The FT square visibility values are shown in Fig. 2.
3.3. Spectro-differential visibilities, phases, and closure phases of S CrA N
Figure 3 displays all the interferometric observables around the Brγ line. The spectrally dispersed visibilities increase in the Brγ line relative to the continuum for all the baselines, indicating that the Brγ emission originates in a region more compact than the continuum emitting region. Similar results were found in previous spectro-interferometric studies of Herbig Ae/Be stars, as well as classical T Tauri sources (see e.g. Kraus et al. 2008; Eisner et al. 2014; Caratti o Garatti et al. 2015; Garcia Lopez et al. 2015; Kurosawa et al. 2016).
Interestingly, our results show a slight displacement of the peak of the total visibilities within the Brγ line with respect to the peak of the line (see the dotted vertical line in Fig. 3) and a change in the shape of the visibilities from baseline to baseline. This suggests the presence of different physical structures in the environment of S CrA N with different kinematic signatures. It should be mentioned, however, that the shift in the peaks of the visibilities within the Brγ line is of the order of a few tens of km s-1; that is, the shifts are smaller than the spectral resolution of our GRAVITY observations.
Mean closure phases of ~2° are present in the largest telescope triplets (UT1-UT3-UT4, UT2-UT3-UT4 and UT1-UT2-UT4), hinting to a slightly asymmetric continuum. This observation agrees well with the absolute closure phase signal of 2.73° ± 2.5° previously detected in the PIONIER H-band observations of S CrA N (Anthonioz et al. 2015). Moreover, this closure phase signal decreases across the Brγ line for the UT1-UT3-UT4 triplet. Even if the dispersion of the signal (of about 1° peak-to-valley) does not allow further conclusions, this might indicate a first detection of an asymmetry in the innermost regions of a CTTS.
3.4. Continuum-compensated Brγ line visibilities of S CrA N
Continuum-compensated (or pure line) visibilities can be derived by considering that the visibilities across the Brγ line have contributions from the line emitting component and from the continuum component. In this case, following the method described in Weigelt et al. (2007), the Brγ line continuum-compensated visibility can be derived from 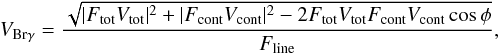 (1)where Ftot = Fcont + Fline, Fline, and Fcont are the total, the line, and the continuum fluxes; Vcont and Vtot are the estimated continuum visibility and the observed total visibility, respectively; and φ is the differential phase measured within the line.
Our GRAVITY HR observations allow us to measure the pure Brγ line visibilities for six spectral channels, namely those with a line-to-continuum ratio higher than 10% (see Fig. 4). Therefore our analysis includes the main spectral component, but unfortunately excludes the high-velocity components. The continuum-compensated Brγ visibilities reveal a change in behaviour from the shortest to the longest baselines. For the three shortest baselines, both blue- and red-shifted line components are unresolved (V ~ 1). The three longest baselines resolve at least one of the two components (V < 1); the blue-shifted component is more extended than the red-shifted one for the 81 m and 93 m projected baselines, whereas the opposite is observed for the 115 m projected baseline.
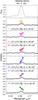 |
Fig. 4 S CrA N continuum-compensated pure Brγ line visibilities (full coloured symbols) computed for each of the six GRAVITY baselines. As a reference, the Brγ line profile normalised to the continuum is displayed in the top panel. The wavelength dispersed visibility amplitudes are overplotted for each PBL (empty grey symbols), along with a spectral binning of the visibility amplitudes (solid grey line). Velocities are with respect to the LSR. |
4. Modelling
4.1. K-band continuum of S CrA N and S
We used the modelling tool developed for the PIONIER instrument to fit the FT data on both components of the binary system (for further modelling details refer to Lazareff et al. 2017). The effective temperature and photospheric index ks at the central wavelength of the K-band for each of the S CrA components were taken from Pecaut & Mamajek (2013), assuming spectral types of G0 and K0 for the North and South components, respectively.
The visibility values at the shortest baseline, especially for the South component (see Fig. 2), cannot be described by a pure Gaussian radial profile, but is described better for example by a Gaussian plus a halo component or a Lorentzian profile. In this case, we have focused our analysis on Gaussian plus halo fitting to be consistent with the Brγ analysis (see Sect. 4.2). The continuum visibilities were then fitted by assuming a linear combination of the stellar component (unresolved at all the baselines), a halo (fully resolved at all baselines), and a circumstellar component, with the flux fraction of each component (fs, fh, and fc respectively) as the combination coefficients. The free fitting parameters are therefore two flux fractions among fs, fh, fc (since the sum of the three fractions equals 1), the spectral index of the circumstellar environment kc over the K band, the inclination i, the projected angle PA (with respect to the major axis of the disc, with north up and east to the left), and a, the angular size (HWHM) of the circumstellar environment for a Gaussian radial profile.
The results of the best fit for each S CrA component are summarised in Table 2, and the best fit model for each source is overplotted in Fig. 2. Both components present the same inclinations (very close to face-on) and the same PAs (along the north-south direction). Considering a distance of 130 pc, as didPrato et al. (2003), the angular sizes of the best fit model translate into 0.108 ± 0.005 au and 0.090 ± 0.005 au, which can be compared to the sublimation radius. According to the authors and the considered spectral type, the total luminosity of the S CrA binary system ranges between 3.0 L⊙ (Prato et al. 2003) and 5.5 L⊙ (Wilking et al. 1992), which can be translated in a range of inner rim radius of 0.11–0.15 au for S CrA N and of 0.06–0.08 au for S CrA S. Our modelling leads to a fraction of total flux over stellar flux of 3.3±0.4 for the North component, and 1.92±0.07 for the South one. These values are consistent with those reported in Prato et al. (2003), namely 2.89±1.60 and 3.15±2.00, for the North and South component, respectively. Finally, we converted the spectral slope of the circumstellar component kc derived from interferometric data into a dust temperature: we obtained dust temperatures varying around 810–1200 K for S CrA N, and around 850–1050 K for S CrA S. These temperatures are lower than the a priori dust sublimation temperature of 1500 K generally considered for the silicate, which is not surprising since a part of the observed circumstellar environment is beyond the dust sublimation radius.
Geometric Gaussian fitting: pure Brγ line visibilities.
4.2. Brγ line emitting region of S CrA N
To further investigate the apparent different dimensions of the red- and blue-shifted components of the Brγ line, we performed a channel-by-channel geometric modelling of the pure Brγ line visibilities shown in Fig. 4, using a Gaussian. First, we fitted the line visibilities with only the Gaussian semi-major axis a as the only one free parameter, and assuming the same disc inclination and PAs as derived for the continuum (Table 2).
Table 3 shows the size of the semi-major axis (aBrγ) of our best Gaussian fittings for each spectral channel, along with the χ2 values of the fitting. Open squares in Fig. B.2 show the results of our fitting for each baseline and spectral channel. In principle, the Brγ line emission is not expected to have the same spatial distribution as the continuum, and indeed, the single-parameter fit shows that at least the angular size is different. Accordingly, similar series of fits were performed with three free parameters: a, i, and PA. The results are listed in Table 3 and shown in Fig. B.2 (triangles). The figure shows that the three-parameter fit is only slightly better than the one-parameter fit. However, its reduced  is worse because of the larger number of free parameters (meaning that the three-parameter-fit χ2 value does not decrease significantly). No significant change in the channel-by-channel size of the Brγ line emitting region within the blue- and red-shifted Brγ line components is observed. However, the values of the PA in the three-parameter fit do give a hint of different structures of the Brγ line emitting region between the blue and red wings of the line. Presumably, the geometry is more complex than our simple models, and our results should be considered as an incentive to perform new observations with a better coverage of the uv plane, allowing more complex models to be tested.
Notably, when averaging the visibilities of the red- and blue-shifted line components over three spectral channels (Fig. B.1 in Appendix B), the averaged pure Brγ line visibilities indeed show a difference between the blue- and red-shifted components for the three longest baselines. The corresponding averaged aBrγ over three spectral channels, at roughly ~–34 km s-1 and ~75 km s-1 on average, shows that the size of the blue-shifted Brγ line emitting region (aBrγ = 0.58 ± 0.07 mas) is larger than the red-shifted one (aBrγ = 0.46 ± 0.03 mas). At a distance of 130 pc, these values correspond to radii of 0.075 ± 0.008 au and 0.060 ± 0.004 au, which is much smaller than the inner rim size and the dust sublimation radius, which is larger than 0.11 au.
It should be noted that in addition to the statistical and observational errors, the absolute values of the continuum compensated Brγ line visibilities could be also affected by the uncertainty on the assumed stellar parameters (e.g. spectral type, continuum flux). Taking this into account, we have recomputed the pure Brγ line visibilities assuming a 10% weaker line flux in the wings and a 10% higher flux of the continuum (see Table B.1). Both scenarios only marginally affect the pure Brγ line visibilities, and our main conclusions are not affected. Finally, it should be noticed that the differential phase values and their errors, were taken into account when estimating the pure continuum compensated Brγ line visibilities. Summarising, the difference in size between the blue- and red-shifted Brγ line components is mainly due to the asymmetry in shape of the total visibilities with respect to the line profile. Furthermore, a different value of the assumed stellar parameters would not change the slope of the pure Brγ line visibilities, as they would affect each spectral channel in the same way, especially at this low spectral resolution.
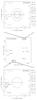 |
Fig. 5 Top: sketch of S CrA N as inferred from our GRAVITY observations. The grey and blue ellipses display the positions of the continuum and the Brγ emitting regions, respectively. The red ellipse displays the inner truncation radius. The red dashed lines show the jet axis position with its uncertainty. Solid coloured lines show the orientation of the baselines along with their lengths and position angles. Middle: sketch of the S CrA system. Bottom: sketch of S CrA S as inferred from our GRAVITY observations in the continuum. |
5. Discussion
Our K-band GRAVITY high spectral resolution results, along with previous H- and K-band AMBER and PIONIER low-resolution observations, add to one of the best-studied T Tauri stars in the NIR continuum dust and its innermost hydrogen circumstellar gas and represent, to date, the first detailed interferometric study of the inner disc regions of a T Tauri binary system (see Fig. 5).
5.1. Continuum emission
The size derived for the continuum (r = 0.108 au) of S CrA N, is in excellent agreement with the values found by Vural et al. (2012, r ~ 0.11 au) and Anthonioz et al. (2015, r ~ 0.108 au). Moreover our estimates of the disc orientation and inclination (PA = 0°± 6° and i = 28°± 3°) are close to those proposed by Pontoppidan et al. (2011) for their disc wind model (PA = 15° and i = 10°, respectively). These values were obtained from the spectro-astrometric analysis of the CO fundamental lines at 4.7 μm. For the spatial orientation of the binary system, the similarity in PA and i of the discs of both components indicates that they were likely formed from the fragmentation of a common gravitationally unstable disc. Indeed, there are two main pathways to form binary or multiple systems: large-scale fragmentation of turbulent cores and filaments or disc fragmentation (see e.g. Adams et al. 1989; Bonnell & Bate 1994; Fisher 2004). There is direct and indirect observational evidence for both mechanisms (see e.g. Jensen & Akeson 2014; Tobin et al. 2016). Direct observation mostly relies on ALMA imaging of the outer dusty disc (tens to hundreds of au), whereas indirect evidence mainly comes from the orientation of the jets (on scales from hundreds to thousands of au). Our analysis demonstrates that NIR interferometry can provide further evidence, giving direct information on the inner dusty disc geometry (down to sub-au scale) and on the system geometry of the binary system.
5.2. Brγ emission line in S CrA N
Our GRAVITY-HR observations of S CrA N show a very compact, but resolved, Brγ emitting region with a radius of r ~ 0.06 au, and thus, located well within the S CrA N dust sublimation radius which is larger than 0.11 au. This small size places the origin of this line in the innermost regions of circumstellar discs, where different physical processes can contribute to its emission: magnetospheric accretion, wind, or heating of the hot upper layers of the disc. Similar results have also been found in other interferometric studies of Herbig Ae/Be and CTTSs (Kraus et al. 2008; Eisner et al. 2014). Indeed the most recent studies of Herbig Ae/Be stars have successfully modelled Brγ interferometric observations using the disc surface (Ellerbroek et al. 2014; Mendigutía et al. 2015), a disc-wind, or a stellar-wind (Weigelt et al. 2011; Garcia Lopez et al. 2015, 2016; Caratti o Garatti et al. 2015; Kurosawa et al. 2016) as the main emitting mechanism for the Brγ line. On the other hand, the origin of the Brγ line in CTTSs is still uncertain (Eisner et al. 2010). This is mostly due to the small size of the emitting region, which requires long baselines (of the order of 100 m or more) to be spatially resolved, as well as high spectral resolution to analyse the different velocity components of the line.
Our GRAVITY observations add a fundamental ingredient to the interpretation of the origin of the Brγ line and the physical processes taking place in the inner gaseous regions of CTTSs. For the first time, it has been possible to constrain the size of the emitting region and tentatively measure slight changes in the continuum-compensated pure Brγ visibilities as a function of the line radial velocity (Fig. 4). Our simple geometric Gaussian fitting points to slightly different dimensions of the region emitting the blue- and red-shifted Brγ line components in S CrA N, with a red-shifted Brγ emitting region slightly smaller than the blue-shifted one (rred ~ 0.060 ± 0.004 au vs. rblue ~ 0.075 ± 0.008 au). It should be noted, however, that our estimates of the continuum compensated Brγ line visibilities are subject to unaccounted uncertainties such as the uncertainty on the spectral type of S CrA N and the continuum level across the Brγ line. Even so, the emitting region of the blue- and red-shifted Brγ line components is, however, around a factor of two larger than the typical CTTS truncation radius of rtrun ~ 5 R∗, that is rtrun ~ 0.03 au assuming a stellar radius R∗ of 1.4 R⊙ (Petrov et al. 2014). This would suggest a wind origin of the Brγ line in S CrA N, that would be supported by the presence of a large-scale protostellar jet arising from this source (Peterson et al. 2011). The base of a wind launched from the disc would initially rotate at the disc Keplerian rotation expected at the location of the footpoint of the wind. Assuming a stellar mass of M∗ ~ 1.5 M⊙ (Prato et al. 2003), the disc Keplerian velocity at a distance from the star of 0.06 au is RVK ~ 150 km s-1, which translates into a radial velocity of ~70 km s-1 assuming a disc inclination angle of i = 28°. This value is then in good agreement with both the Brγ line FWHM (~180 km s-1) measured in S CrA N, and the velocity range (–71 km s-1 < RV < 112 km s-1) used to measure the size of the continuum-compensated Brγ line emitting region. Notably, Pontoppidan et al. (2011) also model a disc-wind from their analysis of the CO fundamental lines in S CrA N. However, this wind is emitted at larger distance from the source (~100 R∗ or ~0.6 au). Therefore, it is reasonable to infer that we are observing the more compact atomic component of a disc-wind, that has an “onion-like” velocity structure, as proposed for example in DG Tau by Agra-Amboage et al. (2014).
On the other hand, given that the difference in size between the blue- and red-shifted Brγ line components is real, our data exclude that the size asymmetry of the Brγ line components might be due to the jet (orthogonal to the disc major axis PA, i.e. 90° ± 6°), as the visibility does not decrease for baselines roughly aligned with the jet PA. Moreover the analysed portion of the Brγ spectrum should not trace the jet emission, likely traced by the high-velocity component and possibly collimated at several au from the source (Ray et al. 2007), thus outside our FoV. We can also exclude that the small difference in size is due to a screening effect by optically thick foreground continuum, as the geometry of the system is almost face on. More likely, the slight size difference between the blue- and red-shifted Brγ line components is due to a compact magnetosphere coexisting with the disc wind emission. As shown in previous interferometric studies, a magnetosphere would only slightly contribute to the total Brγ line intensity, but it would modify the line profile along the wings and increase the continuum-compensated Brγ line visibilities of the red-shifted component (Garcia Lopez et al. 2015, 2016; Kurosawa et al. 2016; Tambovtseva et al. 2016). These characteristic features are, indeed, observed in S CrA N: namely the inverse P Cygni profile in both He i and Brγ lines, and a smaller size of the red-shifted Brγ line emitting region. In contrast, while a disc wind can easily provide the shape of the blue wing, it cannot reproduce alone the red-shifted absorption component, which in turn can be easily shaped by magnetospheric accretion. As already mentioned, previous optical observations of S CrA N display inverse P Cygni profiles in several H i Balmer lines with radial velocities similar to that measured in the Brγ line. In particular, Bertout et al. (1982) find that the red-shifted absorption feature is persistent during twelve consecutive nights. This supports the presence of an accretion column closely viewed pole-on (Kurosawa & Romanova 2013), in agreement with the low inclination angle derived here.
6. Conclusion
Our GRAVITY observations of S CrA in the K band continuum show two disc-like structures around each component of the binary system, with similar inclination and PA, suggesting that they originate from the fragmentation of a common parent disc. Both sources have comparable NIR continuum radii of ~0.1 au, while the dust sublimation radius is about 0.11–0.15 au and 0.06–0.08 au for the North and South components, respectively. Moreover, thanks to our observations at high spectral (R ~ 4000) and spatial resolution, we managed to probe the innermost regions of the S CrA N component: its inner dusty disc encloses a compact Brγ emitting region of r ~ 0.06 au, which is located in the inner gaseous disc but well beyond the truncation radius. Finally, our results indicate the presence of a wind and magnetospheric accretion traced by the Brγ line in S CrA N, and for the first time, a tentative measure of slightly different dimensions of the region emitting the blue- and red-shifted components is attempted. Further observations of a sample of T Tauri stars with different masses, ages and disc properties are planned with GRAVITY in the coming years with the aim of spatially resolving the hot (H I) and warm (CO) gas in discs and investigating the structure, evolution and dynamics of discs of young stellar objects on sub-au scales.
Available at http://www.jmmc.fr/
Available at http://cdsweb.u-strasbg.fr/
Acknowledgments
These results are based on observations made with ESO Telescopes at the La Silla Paranal Observatory under programme IDs 60.A-9102. We thank the technical, administrative, and scientific staff of the participating institutes and the observatory for their extraordinary support during the development, installation, and commissioning of GRAVITY. R.G.L has received funding from the European Union’s Horizon 2020 research and innovation programme under the Marie Skłodowska-Curie Grant Agreement No. 706320. A.C.G. and T.P.R. were supported by Science Foundation Ireland, grant 13/ERC/I2907. J.S.B acknowledges the support from the Alexander von Humboldt Foundation Fellowship Programme (Grant number ESP 1188300 HFST-P). K.P., B.L., M.B., and C.D. acknowledge the support of the French PNPS. This work has been supported by a grant from LabEx OSUG@2020 (Investissements d’avenir – ANR10LABX56). This research has made use of the Jean-Marie Mariotti Center Aspro and SearchCal services1, and of CDS Astronomical Databases SIMBAD and VIZIER2.
References
- Adams, F. C., Ruden, S. P., & Shu, F. H. 1989, ApJ, 347, 959 [NASA ADS] [CrossRef] [Google Scholar]
- Agra-Amboage, V., Cabrit, S., Dougados, C., et al. 2014, A&A, 564, A11 [NASA ADS] [CrossRef] [EDP Sciences] [Google Scholar]
- Alexander, R., Pascucci, I., Andrews, S., Armitage, P., & Cieza, L. 2014, Protostars and Planets VI (Tucson: University of Arizona Press), 475 [Google Scholar]
- Anthonioz, F., Ménard, F., Pinte, C., et al. 2015, A&A, 574, A41 [NASA ADS] [CrossRef] [EDP Sciences] [Google Scholar]
- Appenzeller, I., Jetter, R., & Jankovics, I. 1986, A&AS, 64, 65 [NASA ADS] [Google Scholar]
- Benisty, M., Natta, A., Isella, A., et al. 2010, A&A, 511, A74 [NASA ADS] [CrossRef] [EDP Sciences] [Google Scholar]
- Bertout, C., Wolf, B., Carrasco, L., & Mundt, R. 1982, A&AS, 47, 419 [NASA ADS] [Google Scholar]
- Bonnell, I. A., & Bate, M. R. 1994, MNRAS, 271, 999 [NASA ADS] [CrossRef] [Google Scholar]
- Caratti o Garatti, A., Tambovtseva, L. V., Garcia Lopez, R., et al. 2015, A&A, 582, A44 [NASA ADS] [CrossRef] [EDP Sciences] [Google Scholar]
- Carmona, A., van den Ancker, M. E., & Henning, T. 2007, A&A, 464, 687 [NASA ADS] [CrossRef] [EDP Sciences] [Google Scholar]
- Edwards, S., Fischer, W., Hillenbrand, L., & Kwan, J. 2006, ApJ, 646, 319 [NASA ADS] [CrossRef] [Google Scholar]
- Eisenhauer, F., Perrin, G., Brandner, W., et al. 2011, The Messenger, 143, 16 [NASA ADS] [Google Scholar]
- Eisner, J. A., Chiang, E. I., Lane, B. F., & Akeson, R. L. 2007, ApJ, 657, 347 [NASA ADS] [CrossRef] [Google Scholar]
- Eisner, J. A., Monnier, J. D., Woillez, J., et al. 2010, ApJ, 718, 774 [NASA ADS] [CrossRef] [Google Scholar]
- Eisner, J. A., Hillenbrand, L. A., & Stone, J. M. 2014, MNRAS, 443, 1916 [NASA ADS] [CrossRef] [Google Scholar]
- Ellerbroek, L. E., Podio, L., Dougados, C., et al. 2014, A&A, 563, A87 [NASA ADS] [CrossRef] [EDP Sciences] [Google Scholar]
- Fisher, R. T. 2004, ApJ, 600, 769 [NASA ADS] [CrossRef] [Google Scholar]
- Garcia Lopez, R., Tambovtseva, L. V., Schertl, D., et al. 2015, A&A, 576, A84 [NASA ADS] [CrossRef] [EDP Sciences] [Google Scholar]
- Garcia Lopez, R., Kurosawa, R., Caratti o Garatti, A., et al. 2016, MNRAS, 456, 156 [NASA ADS] [CrossRef] [Google Scholar]
- Gravity Collaboration, Abuter, R., Accardo, M., et al. 2017, A&A, 602, A94 [NASA ADS] [CrossRef] [EDP Sciences] [Google Scholar]
- Jensen, E. L. N., & Akeson, R. 2014, Nature, 511, 567 [NASA ADS] [CrossRef] [Google Scholar]
- Kraus, S., Hofmann, K., Benisty, M., et al. 2008, A&A, 489, 1157 [NASA ADS] [CrossRef] [EDP Sciences] [Google Scholar]
- Kraus, S., Ireland, M. J., Sitko, M. L., et al. 2013, ApJ, 768, 80 [NASA ADS] [CrossRef] [Google Scholar]
- Krautter, J., Appenzeller, I., & Jankovics, I. 1990, A&A, 236, 416 [NASA ADS] [Google Scholar]
- Kumar, M. S. N., Sharma, S., Davis, C. J., Borissova, J., & Grave, J. M. C. 2011, A&A, 533, A137 [NASA ADS] [CrossRef] [EDP Sciences] [Google Scholar]
- Kurosawa, R., & Romanova, M. M. 2013, MNRAS, 431, 2673 [NASA ADS] [CrossRef] [Google Scholar]
- Kurosawa, R., Romanova, M. M., & Harries, T. J. 2011, MNRAS, 416, 2623 [NASA ADS] [CrossRef] [Google Scholar]
- Kurosawa, R., Kreplin, A., Weigelt, G., et al. 2016, MNRAS, 457, 2236 [NASA ADS] [CrossRef] [Google Scholar]
- Lafrasse, S., Mella, G., Bonneau, D., et al. 2010, VizieR Online Data Catalog: II/300 [Google Scholar]
- Lapeyrere, V., Kervella, P., Lacour, S., et al. 2014, in Optical and Infrared Interferometry IV, Proc. SPIE, 9146, 91462 [Google Scholar]
- Lazareff, B., Berger, J.-P., Kluska, J., et al. 2017, A&A, 599, A85 [NASA ADS] [CrossRef] [EDP Sciences] [Google Scholar]
- Mendigutía, I., de Wit, W. J., Oudmaijer, R. D., et al. 2015, MNRAS, 453, 2126 [NASA ADS] [CrossRef] [Google Scholar]
- Neuhäuser, R., & Forbrich, J. 2008, The Corona Australis Star Forming Region, ed. B. Reipurth, 735 [Google Scholar]
- Pecaut, M. J., & Mamajek, E. E. 2013, ApJS, 208, 9 [Google Scholar]
- Peterson, D. E., Caratti o Garatti, A., Bourke, T. L., et al. 2011, ApJS, 194, 43 [NASA ADS] [CrossRef] [Google Scholar]
- Petrov, P. P., Gahm, G. F., Herczeg, G. J., Stempels, H. C., & Walter, F. M. 2014, A&A, 568, L10 [NASA ADS] [CrossRef] [EDP Sciences] [Google Scholar]
- Pontoppidan, K. M., Blake, G. A., & Smette, A. 2011, ApJ, 733, 84 [NASA ADS] [CrossRef] [Google Scholar]
- Prato, L., Greene, T. P., & Simon, M. 2003, ApJ, 584, 853 [NASA ADS] [CrossRef] [Google Scholar]
- Ray, T., Dougados, C., Bacciotti, F., Eislöffel, J., & Chrysostomou, A. 2007, in Protostars and Planets V, eds. B. Reipurth, D. Jewitt, & K. Keil, 231 [Google Scholar]
- Reipurth, B., & Zinnecker, H. 1993, A&A, 278, 81 [NASA ADS] [Google Scholar]
- Sicilia-Aguilar, A., Henning, T., Linz, H., et al. 2013, A&A, 551, A34 [NASA ADS] [CrossRef] [EDP Sciences] [Google Scholar]
- Tambovtseva, L. V., Grinin, V. P., & Weigelt, G. 2016, A&A, 590, A97 [NASA ADS] [CrossRef] [EDP Sciences] [Google Scholar]
- Tannirkulam, A., Monnier, J. D., Harries, T. J., et al. 2008, ApJ, 689, 513 [NASA ADS] [CrossRef] [Google Scholar]
- Tatulli, E., Millour, F., Chelli, A., et al. 2007, A&A, 464, 29 [NASA ADS] [CrossRef] [EDP Sciences] [Google Scholar]
- Tobin, J. J., Kratter, K. M., Persson, M. V., et al. 2016, Nature, 538, 483 [NASA ADS] [CrossRef] [Google Scholar]
- Vural, J., Kreplin, A., Kraus, S., et al. 2012, A&A, 543, A162 [NASA ADS] [CrossRef] [EDP Sciences] [Google Scholar]
- Walker, M. F. 1972, ApJ, 175, 89 [NASA ADS] [CrossRef] [Google Scholar]
- Wang, H., Mundt, R., Henning, T., & Apai, D. 2004, ApJ, 617, 1191 [NASA ADS] [CrossRef] [Google Scholar]
- Weigelt, G., Kraus, S., Driebe, T., et al. 2007, A&A, 464, 87 [NASA ADS] [CrossRef] [EDP Sciences] [Google Scholar]
- Weigelt, G., Grinin, V. P., Groh, J. H., et al. 2011, A&A, 527, A103 [NASA ADS] [CrossRef] [EDP Sciences] [Google Scholar]
- Wilking, B. A., Greene, T. P., Lada, C. J., Meyer, M. R., & Young, E. T. 1992, ApJ, 397, 520 [NASA ADS] [CrossRef] [Google Scholar]
Appendix A: Interferometric observations of S CrA S around the Brγ line and continuum visibilities
Appendix B: Pure Brγ line visibilities of S CrA N
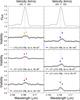 |
Fig. B.1 SCraA N continuum-compensated pure Brγ visibilities (full coloured symbols) computed for each of the six GRAVITY baselines and averaged over three spectral channels. |
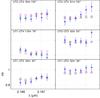 |
Fig. B.2 Best Gaussian fits of the S CrA N continuum-compensated pure Brγ line visibilities (asterisks with error bars) computed for each of the six GRAVITY baselines. Open squares and triangles represent the one-parameter (size) and three-parameter (size, inclination and PA) fits, respectively. |
S CrA N continuum compensated pure Brγ line visibilities.
All Tables
Observation log of the VLTI/GRAVITY high-resolution (R ~ 4000) observations of S CrA North and South conducted with the UTs.
All Figures
|
Fig. 1 GRAVITY observations of S CrA taken during the July campaign showing the spectra of S CrA North (top) and South (bottom). Insets display the velocity calibrated Brγ line profiles. |
| In the text | |
|
Fig. 2 Squared visibility (V2) vs. projected baseline in units of 106λ for four FT spectral channels from our GRAVITY+UT observations of S CrA North (left panel) and South (right panel). The data and best fitting model are represented by filled symbols and crosses, respectively. The absolute value of the fit residuals is shown at the bottom of each panel. Different colours indicate different spectral channels. |
| In the text | |
|
Fig. 3 GRAVITY+UT HR observations of S CrA N on 2016 July 20. The Brγ line profile normalised to the continuum is shown in the top row. The radial velocity is with respect to the LSR. Dashed lines represent smoothed data by two spectral channels. Left: wavelength-dispersed visibility amplitudes measured in the UT3-UT4, UT2-UT4, and UT1-UT4 (middle row), and the UT2-UT3, UT1-UT3, and UT1-UT2 (bottom row) baselines. Middle: same as left, but for the wavelength-dispersed differential-phase signals. For clarity, the differential phases of the first and last baselines have been shifted by +10° and –10°. Right: wavelength-dispersed closure phase signals for the triplets UT2-UT3-UT4 and UT1-UT3-UT4 (middle row), and UT1-UT2-UT4 and UT1-UT2-UT3 (bottom row). |
| In the text | |
|
Fig. 4 S CrA N continuum-compensated pure Brγ line visibilities (full coloured symbols) computed for each of the six GRAVITY baselines. As a reference, the Brγ line profile normalised to the continuum is displayed in the top panel. The wavelength dispersed visibility amplitudes are overplotted for each PBL (empty grey symbols), along with a spectral binning of the visibility amplitudes (solid grey line). Velocities are with respect to the LSR. |
| In the text | |
|
Fig. 5 Top: sketch of S CrA N as inferred from our GRAVITY observations. The grey and blue ellipses display the positions of the continuum and the Brγ emitting regions, respectively. The red ellipse displays the inner truncation radius. The red dashed lines show the jet axis position with its uncertainty. Solid coloured lines show the orientation of the baselines along with their lengths and position angles. Middle: sketch of the S CrA system. Bottom: sketch of S CrA S as inferred from our GRAVITY observations in the continuum. |
| In the text | |
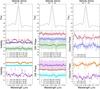 |
Fig. A.1 Same as Fig. 3, but for S CrA S. |
| In the text | |
|
Fig. B.1 SCraA N continuum-compensated pure Brγ visibilities (full coloured symbols) computed for each of the six GRAVITY baselines and averaged over three spectral channels. |
| In the text | |
|
Fig. B.2 Best Gaussian fits of the S CrA N continuum-compensated pure Brγ line visibilities (asterisks with error bars) computed for each of the six GRAVITY baselines. Open squares and triangles represent the one-parameter (size) and three-parameter (size, inclination and PA) fits, respectively. |
| In the text | |
Current usage metrics show cumulative count of Article Views (full-text article views including HTML views, PDF and ePub downloads, according to the available data) and Abstracts Views on Vision4Press platform.
Data correspond to usage on the plateform after 2015. The current usage metrics is available 48-96 hours after online publication and is updated daily on week days.
Initial download of the metrics may take a while.