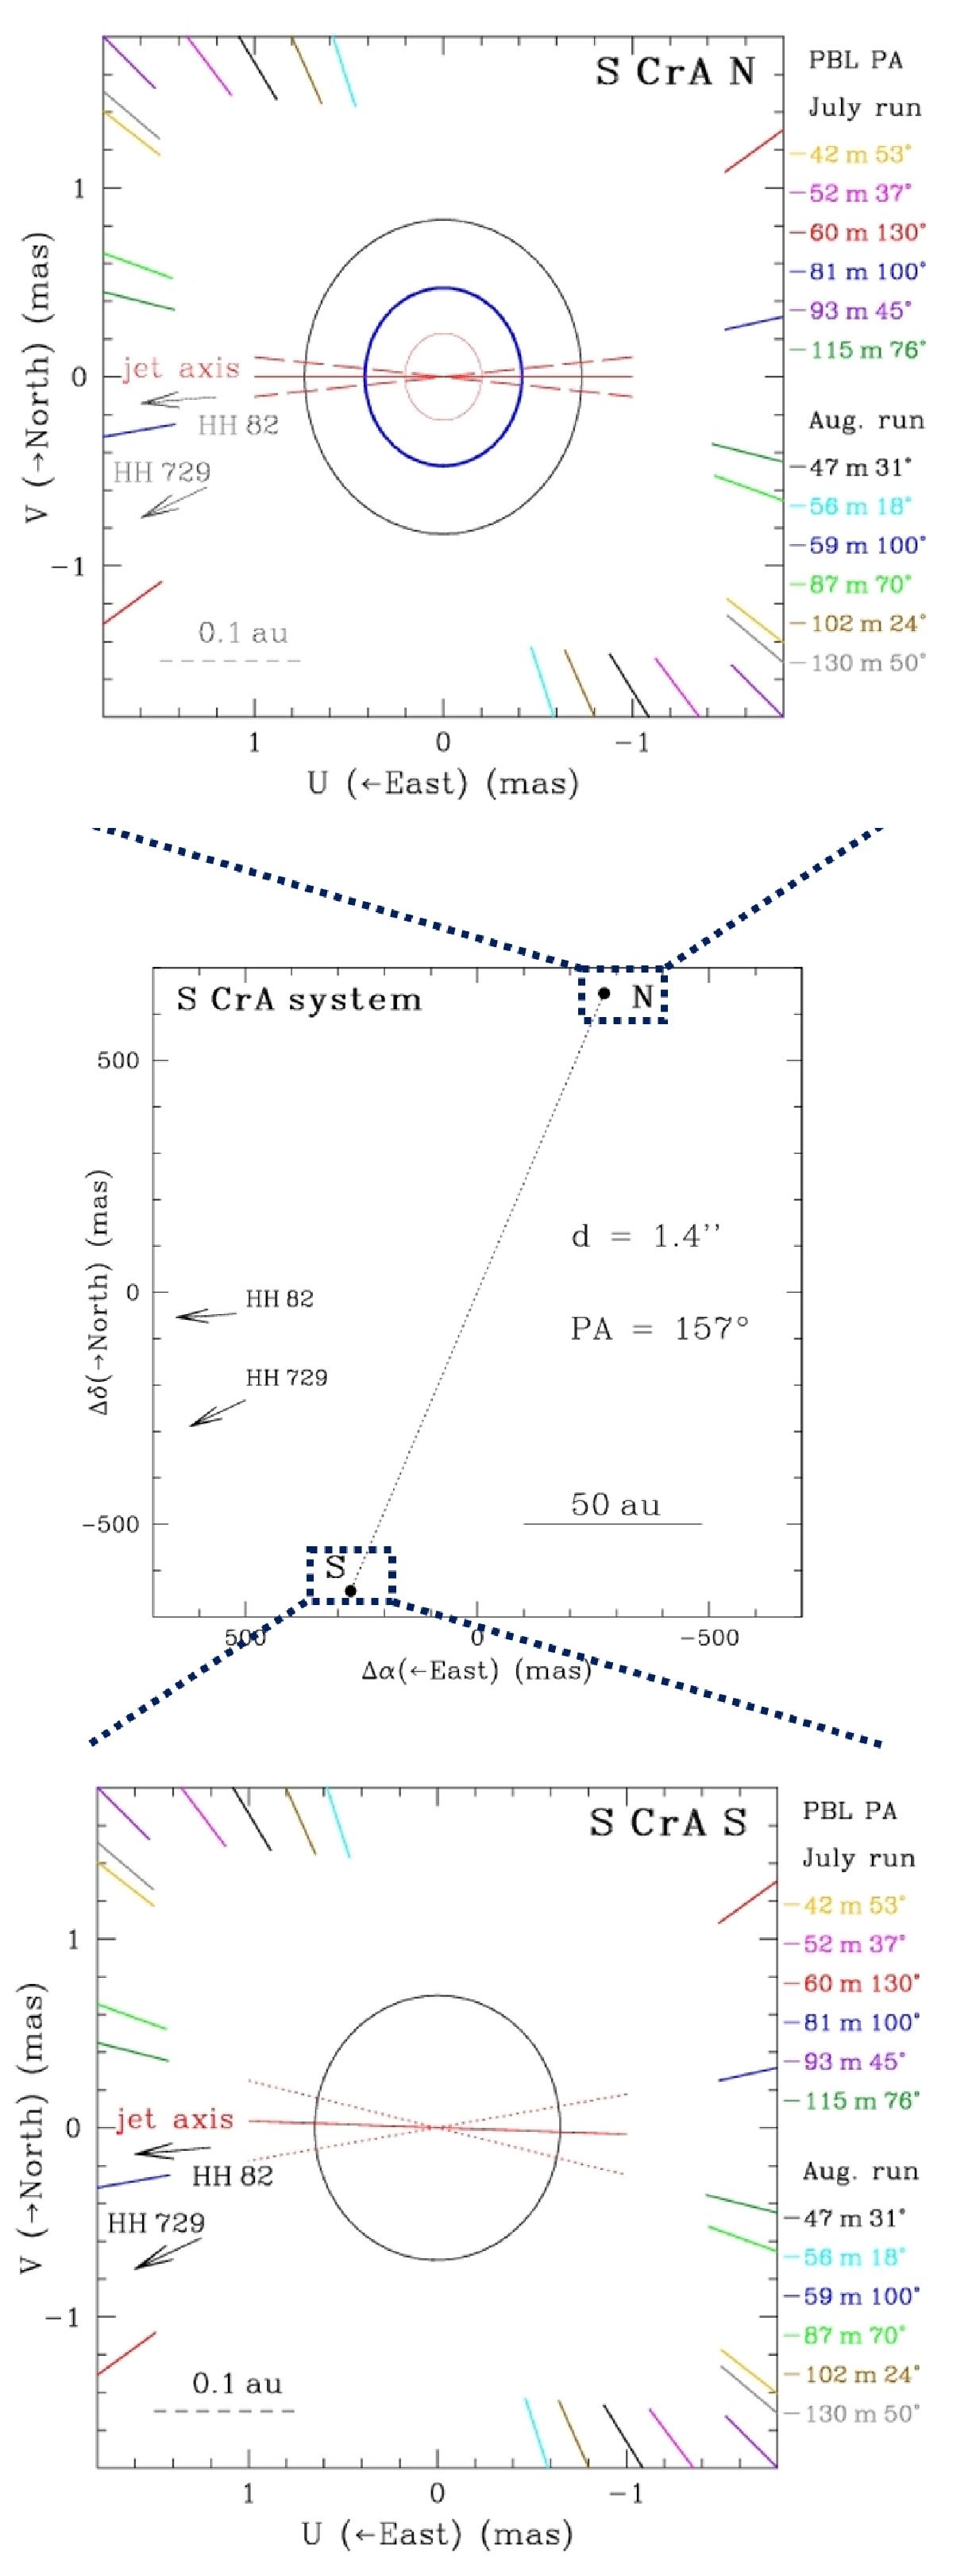
Fig. 5

Top: sketch of S CrA N as inferred from our GRAVITY observations. The grey and blue ellipses display the positions of the continuum and the Brγ emitting regions, respectively. The red ellipse displays the inner truncation radius. The red dashed lines show the jet axis position with its uncertainty. Solid coloured lines show the orientation of the baselines along with their lengths and position angles. Middle: sketch of the S CrA system. Bottom: sketch of S CrA S as inferred from our GRAVITY observations in the continuum.
Current usage metrics show cumulative count of Article Views (full-text article views including HTML views, PDF and ePub downloads, according to the available data) and Abstracts Views on Vision4Press platform.
Data correspond to usage on the plateform after 2015. The current usage metrics is available 48-96 hours after online publication and is updated daily on week days.
Initial download of the metrics may take a while.


