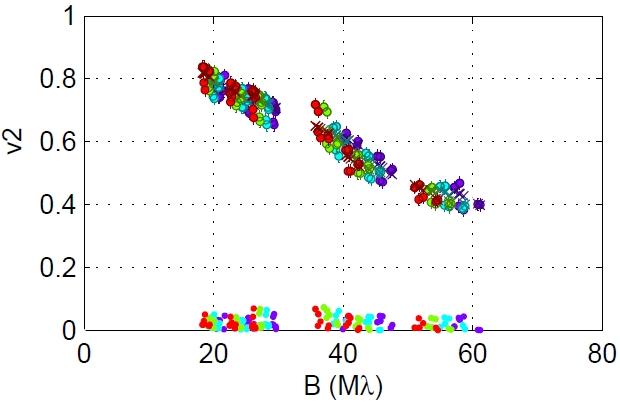
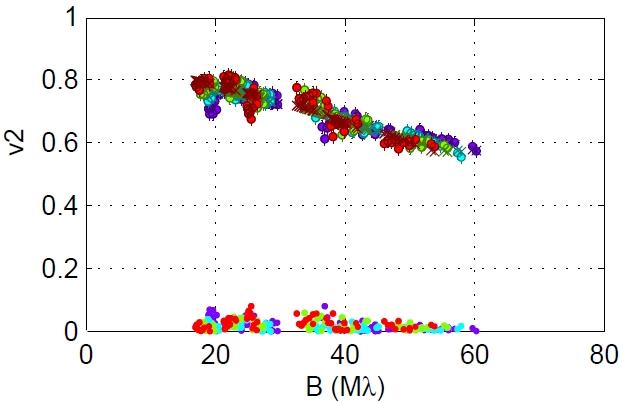
Fig. 2
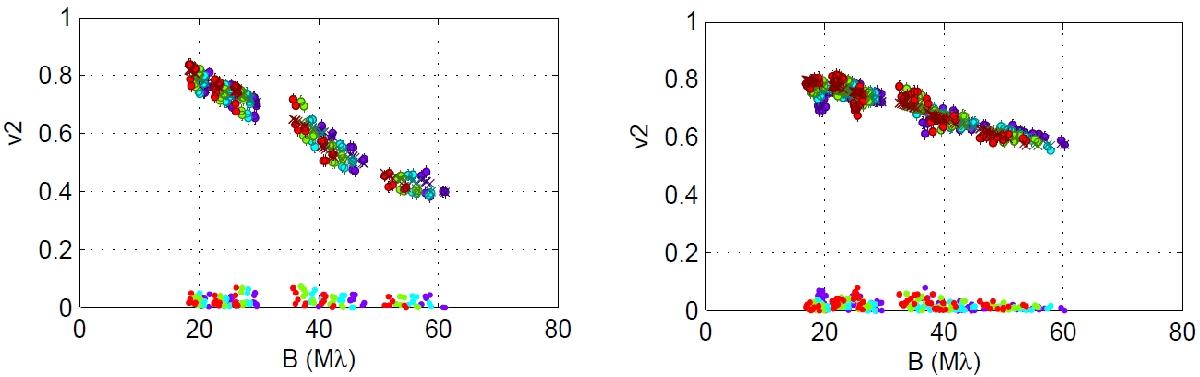
Squared visibility (V2) vs. projected baseline in units of 106λ for four FT spectral channels from our GRAVITY+UT observations of S CrA North (left panel) and South (right panel). The data and best fitting model are represented by filled symbols and crosses, respectively. The absolute value of the fit residuals is shown at the bottom of each panel. Different colours indicate different spectral channels.
Current usage metrics show cumulative count of Article Views (full-text article views including HTML views, PDF and ePub downloads, according to the available data) and Abstracts Views on Vision4Press platform.
Data correspond to usage on the plateform after 2015. The current usage metrics is available 48-96 hours after online publication and is updated daily on week days.
Initial download of the metrics may take a while.