Fig. 3
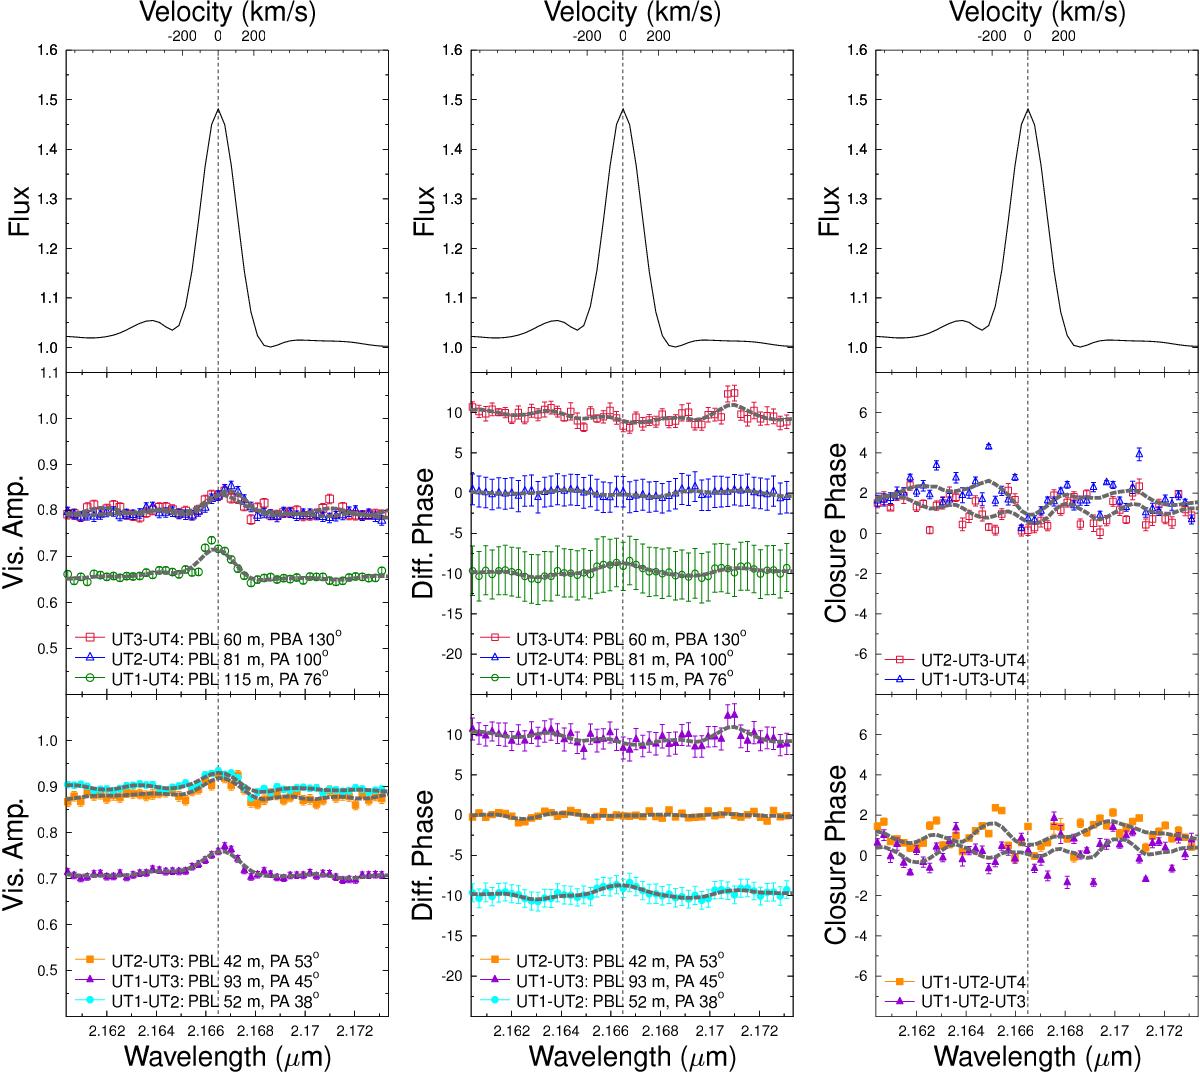
GRAVITY+UT HR observations of S CrA N on 2016 July 20. The Brγ line profile normalised to the continuum is shown in the top row. The radial velocity is with respect to the LSR. Dashed lines represent smoothed data by two spectral channels. Left: wavelength-dispersed visibility amplitudes measured in the UT3-UT4, UT2-UT4, and UT1-UT4 (middle row), and the UT2-UT3, UT1-UT3, and UT1-UT2 (bottom row) baselines. Middle: same as left, but for the wavelength-dispersed differential-phase signals. For clarity, the differential phases of the first and last baselines have been shifted by +10° and –10°. Right: wavelength-dispersed closure phase signals for the triplets UT2-UT3-UT4 and UT1-UT3-UT4 (middle row), and UT1-UT2-UT4 and UT1-UT2-UT3 (bottom row).
Current usage metrics show cumulative count of Article Views (full-text article views including HTML views, PDF and ePub downloads, according to the available data) and Abstracts Views on Vision4Press platform.
Data correspond to usage on the plateform after 2015. The current usage metrics is available 48-96 hours after online publication and is updated daily on week days.
Initial download of the metrics may take a while.