| Issue |
A&A
Volume 596, December 2016
|
|
|---|---|---|
| Article Number | A35 | |
| Number of page(s) | 12 | |
| Section | Interstellar and circumstellar matter | |
| DOI | https://doi.org/10.1051/0004-6361/201629107 | |
| Published online | 28 November 2016 | |
The ortho-to-para ratio of interstellar NH2: quasi-classical trajectory calculations and new simulations
1 Department of Chemistry, University of
Virginia, McCormick
Road, Charlottesville, VA
22904,
USA
e-mail: romane.legal@virginia.edu
2 Department of Chemistry and Chemical
Biology, University of New Mexico, Albuquerque, NM
87131,
USA
3 Key Laboratory of Synthetic and
Natural Functional Molecule Chemistry, Ministry of Education, College of Chemistry and
Materials Science, Northwest University, 710127
Xi’an, PR China
Received:
13
June
2016
Accepted:
6
September
2016
Based on recent Herschel results, the ortho-to-para ratio (OPR) of NH2 has been measured towards the following high-mass star-forming regions: W31C (G10.6-0.4), W49N (G43.2-0.1), W51 (G49.5-0.4), and G34.3+0.1. The OPR at thermal equilibrium ranges from the statistical limit of three at high temperatures to infinity as the temperature tends toward zero, unlike the case of H2. Depending on the position observed along the lines-of-sight, the OPR was found to lie either slightly below the high temperature limit of three (in the range 2.2–2.9) or above this limit (~3.5, ≳ 4.2, and ≳5.0). In low temperature interstellar gas, where the H2 is para-enriched, our nearly pure gas-phase astrochemical models with nuclear-spin chemistry can account for anomalously low observed NH2-OPR values. We have tentatively explained OPR values larger than three by assuming that spin thermalization of NH2 can proceed at least partially by H-atom exchange collisions with atomic hydrogen, thus increasing the OPR with decreasing temperature. In this paper, we present quasi-classical trajectory calculations of the H-exchange reaction NH2 + H, which show the reaction to proceed without a barrier, confirming that the H-exchange will be efficient in the temperature range of interest. With the inclusion of this process, our models suggest both that OPR values below three arise in regions with temperatures ≳20–25 K, depending on time, and values above three but lower than the thermal limit arise at still lower temperatures.
Key words: astrochemistry / ISM: molecules / submillimeter: ISM / molecular processes / line: formation
© ESO, 2016
1. Introduction
Hydrides play a crucial role in astrochemistry as initial building blocks of the chemistry in both diffuse and dense clouds. The new spectroscopic window opened by the Herschel Space Observatory in the submillimeter and in the far-infrared (FIR) has allowed the detection of some fundamental and excited rotational transitions of simple neutral or ionized hydrides in different types of sources and especially towards the cold interstellar medium, in either the envelopes of low- and high-mass star-forming regions or in more distant regions along the lines-of-sight to these objects. In addition to the detection of new hydrides such as ND (Bacmann et al. 2010), HCl+ (De Luca et al. 2012), and ArH+ (Barlow et al. 2013), doubly and triply hydrogenated hydrides in their ortho and para forms such as H2Cl+ (Lis et al. 2010), H2O+ (Ossenkopf et al. 2010; Schilke et al. 2013; Gerin et al. 2013), NH2 and NH3 (Hily-Blant et al. 2010; Persson et al. 2010, 2012, 2016), and H2O (Emprechtinger et al. 2013) have been detected. Some of the ortho-to-para ratios (OPRs) were found to be consistent with their thermal values and some such as the cases of water (Lis et al. 2013; Flagey et al. 2013), H3+ (Crabtree et al. 2011), NH3 (Persson et al. 2012) and NH2 (Persson et al. 2016) were not.
Observing and being able to constrain OPRs in such environments can bring crucial information about the prevailing physical conditions, such as the temperature of the gas, and also, on the other hand, can yield new constraints on the interstellar chemistry occurring in these milieux. For instance, the H2 OPR has been suggested as a chemical clock in cold molecular gas (Flower & Watt 1984; Flower et al. 2006b; Pagani et al. 2009, 2011, 2013; Brünken et al. 2014). Comprehensive analysis of how these OPRs arise involves a deep study of the interstellar chemistry of these simple polyatomic species, which is often poorly known, especially concerning the processes and rates governing (i) the formation of ortho and para species and (ii) the ortho-to-para conversion.
As an example, interest in the interstellar chemistry of nitrogen-hydride species has arisen as a result of observations of the lowest rotational transitions of the nitrogen hydrides NH, NH2 and NH3 at FIR wavelengths towards cold interstellar sources (Bacmann et al. 2010; Hily-Blant et al. 2010; Persson et al. 2010, 2012). During the last decades, different gas-phase and gas-grain models were developed in an attempt to reproduce the observational data of these hydrides but with at most moderate success (Meyer & Roth 1991; Millar et al. 1991; Wagenblast et al. 1993; O’Neill et al. 2002; Hily-Blant et al. 2010).
Based on new theoretical and experimental data (e.g. Flower et al. 2006a; Hugo et al. 2009; Honvault et al. 2011, 2012; Rist et al. 2013; Daranlot et al. 2013, 2012; Jorfi & Honvault 2009), Le Gal et al. (2014b) revised the understanding of nitrogen chemistry by focussing on the study of the basic gas-phase processes for the specific physical conditions of cold molecular gas. They revisited the low temperature kinetics of the nitrogen-bearing species and provided a rigorous nuclear-spin chemistry of the N-hydrides (Rist et al. 2013). The result was a nearly pure gas-phase astrochemical model, which does not consider any grain reactions except the formation of H2 and charge exchange reactions. The network includes nuclear-spin selection rules for the hydrogenated nitrogen molecules and also for the hydrogen chemistry, which plays a crucial role in the synthesis of nitrogen hydrides (Le Bourlot 1991; Dislaire et al. 2012). This model was able to reproduce the abundances and abundance ratios of NH, NH2, and NH3 observed towards the envelope of the protostar IRAS 16293-2422. The model was also the first to lead to an explanation of the puzzling measurements of the OPRs of ammonia in cold diffuse gas (T ~ 30 K), which were found to be (≈0.5–0.7 ± 0.1, Persson et al. 2012; Faure et al. 2013), below the thermal value of unity.
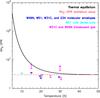 |
Fig. 1 NH2 OPR computed as a function of temperature at thermal equilibrium in black along with the observed OPR values from Persson et al. (2016) in blue, cyan and pink at the lowest values of the observed temperature ranges (Persson et al. 2016). For the sake of clarity the uncertainties of the observed temperatures are omitted. The NH2-OPR statistical value of 3 is represented by the dashed red line. |
More recently, Persson et al. (2016) investigated the non-thermal observational values of the NH2 OPR measured towards the high-mass star-forming regions W31C (G10.6-0.4), W49N (G43.2-0.1), W51 (G49.5-0.4), and G34.3+0.1 including translucent clouds in front of these sources. These authors, focussing their study on the NH2 OPR, did not investigate in detail the column densities of ortho and para NH2. The NH2-OPR values observed by Persson et al. (2016) towards the different sources are displayed in Fig. 1 with the lowest values of the observed temperature ranges. The uncertainties in the observed temperatures are very large; if the upper values were utilized in the figure, the OPR ratio corresponding to these values should never exceed the statistical value of three so that the OPR measurements with values greater than three would likely have much larger uncertainties than reported. Although the use of nuclear-spin selection rules in an improved model leads to the reproduction of most of the observed OPR values below three at reasonable temperatures, it was necessary to find a mechanism that can at least partially thermalize the OPR at particularly low temperatures where the thermal OPR exceeds three and goes to infinity as the temperature goes to 0 K, as shown in black in Fig. 1. This pattern occurs in the opposite sense from the H2 thermal OPR, which is depicted in Fig. 2. The difference arises because of the additional asymmetry of the ground electronic state of NH2.
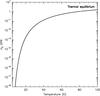 |
Fig. 2 H2 OPR computed as a function of temperature at thermal equilibrium. |
This need led Persson et al. (2016) to consider the poorly studied NH2–H atom-exchange reaction as a mechanism to interconvert NH2 between its ortho and para forms, previously omitted in models. With the assumption that this exchange occurs rapidly in both directions, Persson et al. (2016) were able to explain the large values of the OPR observed in selected cold sources. But the H-exchange reaction between H and NH2 had not been studied in detail. Weak experimental evidence from the saturated three-body reaction to produce ammonia indicates at most a small barrier (Pagsberg et al. 1979), while theoretical calculations indicate a more substantial barrier and a conical intersection (McCarthy et al. 1987; Zhu et al. 2012). In this paper, we present a new theoretical calculation developed to determine if this reaction is a plausible efficient para-to-ortho conversion pathway for NH2. We also determine how our calculated OPR is affected by recent updates concerning gas-phase reactions between NH2 and the abundant oxygen and nitrogen atoms.
In Sect. 2, we discuss the OPR of NH2 at low temperatures and how different non-thermal OPR values can be obtained, while emphasizing the role of the H + NH2 H-exchange reactions. Section 3 begins with a presentation of the theoretical work developed in order to study the H + NH2 H-exchange reaction proposed in Persson et al. (2016). This section continues with our astrochemical results derived from six new nearly pure gas-phase models, which differ from each other concerning: (i) the inclusion of new destruction reactions for NH2; (ii) the initial form of hydrogen; (iii) the cosmic-ray ionization rate; (iv) the gas density; and (v) the sulfur elemental abundance. In Sect. 4, we discuss the results, chiefly our new findings and how they fit the observational data, including the temperature range over which they can reproduce the measured OPR of NH2. Finally, Sect. 5 contains a summary of our calculations and results.
2. NH OPR and ortho-para interconversion
2.1. NH2 OPR under thermal conditions
The NH2 OPR under thermal conditions can be expressed by the equation: 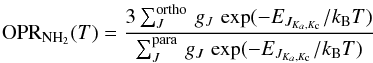 (1)with gJ, the degeneracy of the total angular momentum, EJ the energy of the rotational levels, which also depends on the Ka and Kc pseudo-quantum numbers corresponding to the projections of the total angular momentum J on the symmetry axes of the prolate and oblate symmetric top limits, respectively (Townes & Schawlow 1955). Ortho-NH2 corresponds to Ka + Kc = 2n, and para-NH2 to Ka + Kc = 2n + 1, with n a non-negative integer. For simplicity the fine- and hyperfine-structure energies are omitted in this formula.
Figure 1 shows in black the variation of the OPR of NH2 as a function of the temperature at thermal equilibrium. At high temperatures, where many rotational levels are populated, the thermal OPR is equal to three, the ratio of the statistical weights of all ortho and para levels. At very low temperatures or strongly subthermal rotational excitation, only the lowest ortho and para rotational states are populated. Due to the anti-symmetry of the ground electronic wave function, the ground rotational-spin state (000) is an ortho state of NH2 while the lowest para rotational state (101) lies 30.4 K higher (Persson et al. 2016). Thus, with the additional assumption that the fine-structure and hyperfine-structure energies are degenerate, at low temperatures, the NH2 OPR can be expressed by the equation: 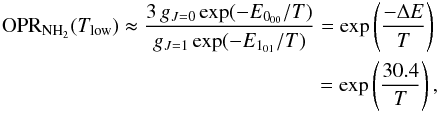 (2)where ΔE = E000 − E101 = −30.4 K is the energy difference between the two ground rotational-spin states. Thus, the low-temperature OPR continues to increase strongly with decreasing temperature.
In the interstellar medium, true thermodyamic equilibrium, at least between kinetic and rotational energy, is only reached at the higher densities attainable. At lower densities, the rotational excitation can be subthermal, so that the rotational temperature lies below the kinetic temperature. In this case, it would be more appropriate to use the rotational temperature in the OPR formulae. For regions in which NH2 is detected in absorption, as is the case for the observed values considered in the present study, the low temperature limit is normally adequate.
2.2. NH2-OPR values below thermal equilibrium
In Persson et al. (2016), it was suggested that those observed NH2-OPR values lower than the thermal value could arise because in such low temperature environments H2 is para-enriched. The H2 OPR controls the key initiating reaction involved in the formation of nitrogen hydrides and in particular the formation of the ammonium ion, NH , the main direct precursor of NH2 in cold dense gas (Persson et al. 2016). NH2 can also be produced through the dissociative recombination of NH3+ with electrons. This pathway is not dominant for cold dense gas but can become more efficient for diffuse and translucent gas, where the electron fraction is higher. For dense cold gas conditions, the nuclear spin branching ratios in the dissociative recombination with electrons of the three spin configurations of NH (ortho, meta, and para) primarily determine the NH2 OPR if it is only due to formation processes, according to the formula:
 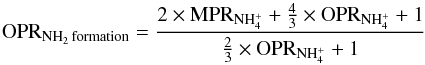 (3)where MPR stands for meta-to-para ratio. Considering these nuclear-spin selection rules, the gas-phase spin-conservation model developed in Le Gal et al. (2014b,a) was able to reproduce the NH2-OPR values below the statistical value of 3:1 observed towards the molecular envelopes of W31C, W51 and G34.3, and in translucent gas towards W31C. However, as mentioned in the Introduction, this model was not able to reproduce a variety of NH2-OPR values above three found towards the molecular envelope of W49N, a dense filament connected to W51, and some translucent gas towards W31C and W49N.
2.3. Plausible H-exchange reaction between o-NH2 and p-NH2
In order to understand the NH2-OPR values found above the statistical value of three, Persson et al. (2016) suggested that once formed, the NH2 ortho and para radicals should undergo an H-exchange reaction with H, allowing interconversion between the lowest rotational states of ortho-NH2 and para-NH2, hereafter o-NH2 and p-NH2 respectively:  (4)Such processes are likely to thermalize the OPR given sufficient time. But if the reactive collisions are inefficient, either because they are inherently slow or because there are faster competitive destruction mechanisms, the OPR should lie in between the formation value of the NH2 OPR, produced by exothermic dissociative electronic recombination of NH, and the thermalized value, e.g. 7.6 at 15 K or 21 at 10 K. If, on the other hand, the average time between two successive ortho/para exchange collisions between H and NH2 is negligible compared with the average lifetime of NH2 then the NH2 OPR should reflect the temperature of the gas and follow the LTE OPR, which can be quite high at sufficiently low temperatures.
To quantify these points, Persson et al. (2016) added the following two reactions to the Le Gal et al. (2014b) model: ![\begin{eqnarray} &&\ensuremath{\rm H + o}\text{-}{\rm NH_2} ->[k_{\rm{o \rightarrow p}}] {\rm H} + \text{p-}\ensuremath{\rm NH_2,}\label{eq:conversion_onh2_pnh2} \\ &&\ensuremath{\rm H + p}\mbox{-}{\rm NH_2} ->[k_{\rm{p \rightarrow o}}] {\rm H + o}\mbox{-}\ensuremath{\rm NH_2,}\label{eq:conversion_pnh2_onh2} \end{eqnarray}](/articles/aa/full_html/2016/12/aa29107-16/aa29107-16-eq30.png) with ko → p = kp → oexp(−30.4 /T) cm3 s-1, which should be accurate at low temperatures. For the kp → o rate coefficient, a typical radical-radical value of 1 × 10⁻¹⁰ cm3 s-1 was chosen initially.
with ko → p = kp → oexp(−30.4 /T) cm3 s-1, which should be accurate at low temperatures. For the kp → o rate coefficient, a typical radical-radical value of 1 × 10⁻¹⁰ cm3 s-1 was chosen initially.
We label, as Model 1, the model b used in Persson et al. (2016), which takes into account the network of reactions of Le Gal et al. (2014b) with the addition of the forward and backward NH2 + H reactions (5) and (6). The physical fixed conditions used to run this model are typical of dense gas: a density nH = 2 × 104 cm-3, the commonly used value ζ = 1.3 × 10⁻¹⁷ s-1 for the cosmic-ray ionization rate (Spitzer & Tomasko 1968; Prasad & Huntress 1980; Wakelam et al. 2005; Vastel et al. 2006) and a visual extinction of 10 mag. The initial abundances are those used in Persson et al. (2016). In particular for the C/O and sulfur elemental abundance, Persson et al. (2016) chose values that best fit the observed N-hydride abundances: 0.6 and 3 × 10⁻⁶, respectively. Despite the fact that dense gas models usually consider a higher depleted sulfur elemental abundance, this value remains poorly constrained in dense gas. However, lately the use of such a high value has been required to fit observations in the Horsehead nebula (Goicoechea et al. 2006) and even more recently in the Barnard 1 region (Fuente et al. 2016). The modifications leading to other models will be discussed later. With observed temperatures assumed to be near the bottom of the observed temperature ranges (Persson et al. 2016), Model 1 reproduces the NH2-OPR values observed above three at appropriate times and temperatures (Persson et al. 2016), as shown in Fig. 3 by the dashed red line. The range of times is less than the time to steady state.
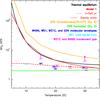 |
Fig. 3 NH2 OPR as a function of temperature computed: (i) at thermal equilibrium; (ii) with Model 1 at steady state and an earlier time which best fits the observed values; and (iii) with the analytical formulae (3) and (9). The details of Model 1 are described in Sect. 2.3. The observed OPR values from Persson et al. (2016) are represented within their error bars in blue, cyan and pink at the lowest values of the observed temperature ranges (Persson et al. 2016). For the sake of clarity the uncertainties of the observed temperatures are omitted. |
The model results at steady state can be analytically understood as follows. The evolution of the o-NH2 and p-NH2 abundances can be expressed by the following simple kinetic equations: ![\begin{eqnarray} \frac{{\rm d}[\ensuremath{\rm o}\mbox{-}{\rm NH_2}]}{{\rm d}t} &= &F_{\rm o} -[\ensuremath{\rm o}\mbox{-}{\rm NH_2}]D_{\rm o}\\ \frac{{\rm d}[\ensuremath{\rm p}\mbox{-}{\rm NH_2}]}{{\rm d}t} &=& F_{\rm p} - [\ensuremath{\rm p}\mbox{-}{\rm NH_2}]D_{\rm p}, \label{eq:NH2-ab_evol} \end{eqnarray}](/articles/aa/full_html/2016/12/aa29107-16/aa29107-16-eq40.png) where Fo and Fp are the formation rates and Do and Dp the effective destruction rate coefficients for o-NH2 and p-NH2, respectively. With the assumption that the destruction rate coefficients are dominated by the H-exchange reactions, we obtain at steady state that
where Fo and Fp are the formation rates and Do and Dp the effective destruction rate coefficients for o-NH2 and p-NH2, respectively. With the assumption that the destruction rate coefficients are dominated by the H-exchange reactions, we obtain at steady state that  (9)The NH2 OPR obtained from the formation rates, expressed in Eq. (3), does not have any temperature dependence in the temperature range considered (Persson et al. 2016), as displayed in green in Fig. 3. Thus, the simple analytical expression of Eq. (9) for the NH2 OPR at steady state reflects the increase with decreasing temperature as also seen in Model 1. Indeed, the analytical expression for the NH2 OPR runs parallel to but somewhat above the thermal equilibrium result as represented in mustard yellow in Fig. 3, while the Model 1 result at steady state, in the red solid line, is almost identical to the thermal equilibrium result in black over a wide temperature range. A more detailed discussion of an improved analytical approximation with other destruction processes for the ortho and para forms of NH2 can be found later in the text. Other destruction processes will lessen the importance of the NH2 + H ortho-para exchange reactions and reduce the calculated OPR values.
The significant impact of the H + NH2 H-exchange reactions on the NH2 OPR at low temperatures has led us to investigate the reactions from a theoretical point of view. In the next section, we discuss our calculations of the rate coefficients.
3. Results
3.1. Theoretical calculations of the H + NH2 H-exchange reaction-rate coefficients
It is impossible to simulate directly the conversion between the ortho and para forms of NH2 using classical mechanics because it does not recognize symmetry of the wave function, yet a quantum mechanical scattering calculation is still too expensive numerically. In this work, we provide an estimate of the low-temperature rate coefficient for the exchange reaction H′ + NH2 − → NHH′ + H, serving as a proxy of the ortho-para conversion. The calculations were carried out using a modified quasi-classical trajectory (QCT) method (Hase 1998) as described below. The potential energy surface (PES) used in the QCT calculation is from that devised by Zhu and Yarkony (ZY) and their coworkers (Zhu et al. 2012) which is a 2 × 2 quasi-diabatic permutation invariant potential matrix designed for studying the photodissociation of ammonia (NH3) in its first absorption band. Quantum dynamical studies on this PES have achieved excellent agreement with experimental data, validating the PES (Ma et al. 2012; Xie et al. 2014). Only the lower adiabat, which corresponds to the ground electronic state of NH3, was used in our calculations reported here. In Fig. 4, the minimum energy path from the H + NH2 asymptote is displayed and clearly there is no barrier.
A major deficiency of the QCT method is the possible violation of zero-point energy (ZPE). This problem is especially severe at low temperatures, because ZPE represents a large fraction of the total energy. In this work, the ZPE effect is approximately dealt with using a scheme newly proposed by Hase and coworkers (Paul & Hase 2016). When a trajectory exits the strongly interacting region, the vibrational energy of the NH2 is calculated. If the energy is less than the ZPE, the momenta of all atoms in the system are reversed and the trajectory is forced back to the strongly interacting region without violating energy conservation. Only those trajectories with NH2 internal energies larger than the ZPE are allowed to dissociate.
QCT calculations in this work were implemented in VENUS (Hu et al. 1991). The trajectories were initiated with a 9.0 Å separation between reactants, and terminated when products reached a separation of 6.0 Å. The ro-vibrational energies of the NH2 reactant and relative translational energies were sampled from the Boltzmann distribution at a specific temperature. The propagation time step was selected to be 0.05 fs. Trajectories were discarded if (a) the propagation time reached 100 ps in each interval of two consecutive momentum reversing operations; (b) the number of momentum reversing exceeds 100; or (c) the total energy failed to converge to 0.05 kcal/mol. The maximal impact parameters (bmax) were 8.2 and 7.8 Å for 50 and 100 K, respectively. A total of 1144 (2117) trajectories were calculated at 50 (100) K. The thermal rate coefficient is computed by the following expression: 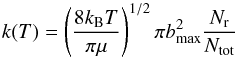 (10)where Nr and Ntot are the numbers of reactive and total trajectories and μ is the reduced mass of reactants.
Table 1 lists the calculated rate coefficients for the H + NH2 H-exchange reaction with/without the ZPE constraint. For the results with the ZPE constraint, the statistical errors at two temperatures are somewhat large due to smaller number of accepted trajectories. It can be noticed that the results with the ZPE constraint are much smaller than those without the ZPE constraint. The exchange reaction proceeds via a complex-forming mechanism, and trajectories spend most of the time in the NH3 potential well. The small rate coefficients reflect, at least partially, the very inefficient energy randomization in the NH3 complex.
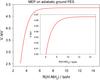 |
Fig. 4 Minimum energy path (MEP) from the H + NH2 asymptote on the ground potential energy surface (PES) of NH3. |
Rate coefficients of the H+NH2 exchange reaction with/without the ZPE constraint.
Concerning the rate coefficients computed and presented in Table 1 one can wonder if these theoretical calculations are still valuable at temperatures below 50 K since interstellar temperatures in the regions of interest for the NH2 observations range down to 10 K with the lower temperatures the more interesting. Especially one can wonder how rapid the NH2 + H reaction might be at such low temperatures, given that the ZPE problem might be worse. Due to the computational costs, the calculations at lower temperatures (i.e.<50 K) would have been even more demanding, as fewer and fewer reactive trajectories can be found. So we did not think it worthwhile to do it because all that we need is an estimate of the order of magnitude, and the data at 50 K should be able to provide that. Thus, as a result, these theoretical calculations clearly show that (i) there is no barrier for the H + NH2 H-exchange reaction as one can see in Fig. 4 and (ii) our calculated coefficient (~10-10 cm3 s-1) is consistent with that chosen in Persson et al. (2016).
3.2. Impact of the H-exchange rate coefficient on the NH2 OPR
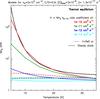 |
Fig. 5 Impact of the kp → o rate coefficient of the H + NH2 H-exchange reaction on the NH2 OPR as a function of temperature computed with Model 1 for the physical conditions given in the super title at steady state and an earlier time. The details of Model 1 are described in Sect. 2.3. |
The theoretical calculations of the H + NH2 H-exchange rate coefficient discussed in Sect. 3.1 have shown that the use of 1 × 10⁻¹⁰ cm3 s-1 for kp → o in Model 1 is realistic, although there are uncertainties in the calculation involving the role of the ZPE. In order to study the impact of lowering this rate coefficient on the efficiency of the H + NH2 H-exchange reaction, we present in this section the results when the kp → o rate coefficient is gradually lowered. In Fig. 5, the results are plotted for the values 1 × 10⁻¹⁰ cm3 s-1 (red lines) 1 × 10-11 cm3 s-1 (dark green lines), 1 × 10-12 cm3 s-1 (blue lines), and 1 × 10-13 cm3 s-1 (cyan lines). We see that decreasing the H + NH2 H-exchange reaction rate coefficient until 1 × 10-13 cm3 s-1 in Model 1 gradually lowers the increase in the OPR as temperature is decreased.
NH2 and NH destruction updates. The updated rates are from the KIDA database with the references given in the last column.
By a certain rate coefficient, here 1 × 10-13 cm3 s-1, the model can no longer produce OPR values above 3 at the lowest temperatures considered. Also for most values of the exchange rate coefficient, the OPR values calculated at a time earlier than steady state are lower than at steady state although this is not the case for the lowest rate coefficient. Thus, even if kp → o is several orders of magnitude lower than the calculated value, OPR values greater than three can still be obtained, at least at steady state, at astronomically meaningful temperatures, and used to explain the high OPR values from Persson et al. (2016) depicted in Figs. 1 and 3.
3.3. Impact of chemical updates on the NH2 OPR and abundances
In this section we present the results obtained with a new model, Model 2, which contains new or revised destruction processes for NH2 and NH. For NH2, we include a new destruction pathway with atomic nitrogen and a revision of the destruction rate coefficient with atomic oxygen, while for NH, we update several rate coefficients for its destruction (Wakelam et al. 2013). This model is represented in mustard yellow in Fig. 6, which contains a plot of the OPR for NH2 as a function of temperature for an early time and at steady state. The new and revised rate coefficients for NH2 and NH destruction are presented in Table 2.
The N + NH2 reaction, which was not included in previous models (Le Gal et al. 2014b; Persson et al. 2016), was experimentally studied by Whyte & Phillips (1983) and Dransfeld & Wagner (1987) and has been shown to have one main efficient exothermic production channel: N2 + H + H (Whyte & Phillips 1984). So this reaction adds an NH2 destruction pathway with a temperature-independent rate coefficient of 1.2 × 10⁻¹⁰ cm3 s-1. The updated rate coefficient for the NH2 + O reaction increases the destruction rate by a factor of 20. With these enhancements, the new and updated destruction rate coefficients for NH2 affect the temperature dependence of the OPR by competing with the H + NH2 H-exchange reaction and reducing its effect, as represented in Fig. 6 where we compare Model 2 with Model 1, which contains less effective destruction rates for NH2, at two different timescales. In this figure, it can be noted that the updates highly affect the steady-state results, for which the thermalization processes is strongly inhibited. Consequently, Model 2 can barely lead to OPR values greater than three at low temperatures.
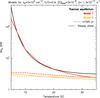 |
Fig. 6 OPR of NH2 computed as a function of temperature for the physical conditions given in the super title at thermal equilibrium, and at steady state and an early-time for Models 1 and 2. The details of the models can be found in Sects. 2.3 and 3.3, respectively. Note again that the Model 1 result at steady state lies close to the equilibrium result over a wide range of temperatures. |
From an analytical point of view, Eq. (9) must now include these destruction processes, and thus becomes: ![\begin{equation} {\rm OPR_{{NH_2}}} = {\rm OPR_{{NH_2} \, formation}} \times \frac{k_{\rm{p \rightarrow o}}[\rm H]+k_{\rm O}[O]+k_{\rm N}[N]}{k_{\rm{o \rightarrow p}}[\rm H]+k_{\rm O}[O]+k_{\rm N}[N]} \label{eq:opNH2-dependence2}, \end{equation}](/articles/aa/full_html/2016/12/aa29107-16/aa29107-16-eq67.png) (11)where the new rate coefficients refer to the sum of the reaction channels. With the updated NH2 destruction rates by N and O, these processes are no longer negligible compared with the H + NH2 H-exchange reaction since these updated rates are the same order of magnitude as the H-exchange reaction for two reasons. First, the rate coefficients are ≈1 × 10⁻¹⁰ cm3 s-1 and, in addition, the abundances of N and O remain larger than that of H, by factors of ~2 and ~5 respectively, until ~106 yr, as shown in Fig. 7, by the comparison of Model 1 (our old model) and Model 2, which contains the NH2 destruction updates. So we need to find a new way to efficiently thermalize the NH2 OPR at the lower temperatures.
(11)where the new rate coefficients refer to the sum of the reaction channels. With the updated NH2 destruction rates by N and O, these processes are no longer negligible compared with the H + NH2 H-exchange reaction since these updated rates are the same order of magnitude as the H-exchange reaction for two reasons. First, the rate coefficients are ≈1 × 10⁻¹⁰ cm3 s-1 and, in addition, the abundances of N and O remain larger than that of H, by factors of ~2 and ~5 respectively, until ~106 yr, as shown in Fig. 7, by the comparison of Model 1 (our old model) and Model 2, which contains the NH2 destruction updates. So we need to find a new way to efficiently thermalize the NH2 OPR at the lower temperatures.
From Fig. 7, it can also be noticed that at 20 K the abundances of both ortho and para NH2 are decreased by the updates of the NH2 destruction reactions. At steady state, these decreases are factors of ~130 and ~70, respectively, while at more physical early times such as 106 yr, the decreases are ~50 and ~30, and at 105 yr, they are ~2.4 for both ortho and para cases. Thus, the predicted overall abundance of NH2 is decreased, but the effect is only large at long times. Rather than compare the reduced total NH2 abundance with observed values here in more detail, we prefer to delay this comparison to a future paper in which we will utilize a gas-grain chemical network more appropriate for total abundances.
Different models used in this work.
3.4. Impact of a non-zero initial atomic hydrogen abundance
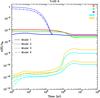 |
Fig. 7 Evolution of the abundances of H, N, O, p-NH2 (NH2 in cyan), and o-NH2 (NHH in yellow) computed at 20 K as functions of time with Models 1, 2, 3, and 4. The different models are described in Table 3. |
The extent of thermalization of the NH2 OPR at low temperatures will be increased by increasing the amount of atomic hydrogen in the gas phase, using alterations commonly used in other models. One way to do so is to run the model with the hydrogen elemental abundance initially in its atomic form rather than fully molecular. Model 3 contains this change, and is otherwise identical with Model 2, as described in Table 3. The amount of atomic hydrogen as a function of time is increased up to a time of ~105 yr for the model runs at 20 K, as displayed by the dotted lines in Fig. 7, where an enhancement ranging up to several orders of magnitude can be seen, such that the H abundance far exceeds the abundances of O and N. As a consequence, the NH2 destruction reactions by N and O are negligible compared with the H-exchange reaction, which can then thermalize the NH2 OPR. Figure 8 shows the NH2 OPR as function of temperature at thermal equilibirum and for Models 1−3 at different timescales. From this figure, one can see that the low temperature thermalization of Model 1 at steady state is recovered in Model 3 but only at earlier times. Above a timescale of ~2 × 10⁵ yr, the thermalization becomes less efficient due to the decrease of the atomic hydrogen abundance.
Since our astrochemical model is a pseudo-time dependent model, meaning that the physical conditions are fixed for the entire simulation as a function of time, it would probably be more realistic to start with hydrogen initially half atomic and half molecular. This constitutes Model 4, for which the OPR results are represented in Fig. 9 and the H, N, O, o-NH2 and p-NH2 abundances at 20 K by the dashed-dotted lines in Fig. 7. The results are quite similar to those for Model 3, by comparison of the dotted and dashed-dotted lines in the figure.
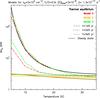 |
Fig. 9 Same as Fig. 8 but with Model 4 results replacing those of Model 1. This figure highlights the impact of the initial chemical condition on the OPR of NH2 as a function of temperature. |
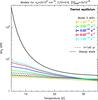 |
Fig. 10 NH2 OPR computed with Model 2 for different cosmic-ray ionization rates. The NH2-OPR values are plotted at two different times: 1 × 10⁵ yr and at steady state. |
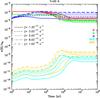 |
Fig. 11 Evolution of the abundances of H, N, O , p-NH2 (NH2 in cyan) and o-NH2 (NHH in yellow) computed at 20 K with Model 2 as functions of time and for different cosmic-ray ionization rates. The details of Model 2 can be found in Table 3. |
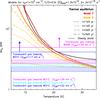 |
Fig. 12 Calculated OPR of NH2 computed as a function of temperature for a density of nH = 1 × 103 cm-3 for translucent sources. Shown are OPR values for thermal equilibrium and Models 6–7 at assorted times. The hatched boxes represent the OPR measurements from Persson et al. (2016) within their formal errors, for the translucent gas towards W31C found at three different gas velocities. The dotted horizontal lines with arrows mark the lower limits in the translucent gas towards W31C in blue and W49N in pink. The temperature range is limited to 5–35 K even though the observed ranges can be as large as 100 K. See text. |
3.5. Impact of the cosmic-ray ionization rate
Another possible way to increase the atomic hydrogen abundance in the gas phase is to vary the cosmic-ray ionization rate, ζ, which is not well constrained in dense cold gas. We have varied ζ in between the commonly used value of 1.3 × 10⁻¹⁷ s-1 and 1 × 10-16 s-1, which lies at the upper limit for dark cores (see e.g. Caselli et al. 1998). The OPR values that we obtained by running Model 2 with these different values of the cosmic-ray ionization rate are displayed in Fig. 10 as functions of temperature at steady state and an earlier time. As can be seen, increasing the cosmic-ray ionization rate increases the thermalization of the NH2 OPR at low temperatures. The results in Fig. 11 show that increasing ζ increases the atomic hydrogen abundance in the gas phase and thus makes the H + NH2 H-exchange reaction more efficient compared to the destruction reactions of NH2 by N and O.
Specifically, we find that increasing the cosmic-ray ionization rate by one order of magnitude increases the abundance of hydrogen by approximately the same amount, and also that even an increase to ζ = 3 × 10-17 s-1, a factor approximately two times the standard value, allows the model to produce NH2-OPR values above 3. This particular model is named Model 5 in Tables 3. Interestingly, the increased thermalization in Model 5 complements the increased thermalization produced by an initial non-zero abundance of atomic hydrogen in that the impact of the ionization rate starts to affect the hydrogen abundance at a few 104 yr, as depicted in Fig. 11, and so increases the efficiency of the H-exchange reaction with time, contrary to the effect observed when only increasing the initial atomic hydrogen abundance.
3.6. Translucent clouds
For the NH2 OPR observed in translucent gas towards W31C (from 2.0 to 3.1 and ≳4.2) and towards W49N (≳5) (Persson et al. 2016) we ran two more models, labeled Model 6 and Model 7. These models both contain a lower gas density of nH = 1 × 103 cm-3, a higher sulfur elemental abundance of [S] tot = 1.3 × 10⁻⁵, corresponding to the cosmic value (Asplund et al. 2009), and a higher ζ of 2 × 10-16 s-1. These values are more appropriate values for translucent to diffuse gas. Model 6 has an initial abundance of hydrogen that is totally molecular, while Model 7 starts with 50% H and 50% H2. The NH2-OPR values obtained with these models as functions of the temperature are shown in Fig. 12 for different timescales from 104 yr to steady state, along with the observed values, within their formal errors, represented by hatched boxes and by the dotted pink and blue lines for the lower limits. Because the constraints on the temperatures corresponding to the observations other than OPR values are weak (Persson et al. 2016), we choose in Fig. 12 to represent the observed OPR values along a temperature range from 5 K to 35 K only, allowing one to see how each model can fit the observations on over portions of this range. From figures such as this, one can determine the temperature ranges at a given timescale when the model OPR values are in agreement with those of observed sources.
4. Discussion
The temperature ranges for which each model reproduces the NH2-OPR values within their uncertainty ranges are tabulated in Table A.1. The table is constructed in the following format: the first column on the left lists the three types of sources observed and studied: molecular envelopes, dense and cold cores, and translucent gas. In each category, we tabulate the observed NH2 OPR and range of temperatures associated with the sources in the regions W31C, W49N, W51, and G34. Unless the OPR values have very large uncertainties, the observed temperature ranges likely pertain to a diversity of regions not included in the OPR observations, which have a tight constraint on the temperature range, corresponding to the lowest values of the observed ranges. We then list the models that can reproduce the observed OPR values over some temperature range, which may or may not overlap with the observed range of temperatures. Several timescales are listed for each model. For example, consider the molecular envelope in W49N, which has an OPR of 3.5. This value can be matched by Models 1, 4, and 5, but none of these models can also match the high upper limit of the observed temperature ranges, which is as high as 120 K. On the other hand, consider the cold core in W51, where the OPR is measured to be 3.4. This can be matched by Models 1, 4, and 5. The observed temperature range for W51 is 10–30 K. All three models present smaller temperature ranges within this rather large observational range. Finally, we consider the translucent gas in W49N. Here the OPR value of ≥5.0 is matched by Models 1′, 6, and 7. The observed temperature of ≤15 K is matched well by the three models. Note that Model 1′ is similar to Model 1 except that the density, ionization rate and sulfur abundance are those used for the translucent case, as described in Table 3.
For those models with the thermalization of the OPR for NH2 activated, we must also investigate how this activation changes the degree of agreement with OPR values for sources at higher temperatures, where these values are lower than three. As described in Table A.1, Models 2, 4, and 5 for dense sources, and Models 1′, 6 and 7 for translucent sources generally fit the data, despite the fact that the range of the observed temperature uncertainties is large. Since the models presented in this study always give smaller temperature ranges than the observed ones, and towards the lower range of temperature, we are tempted to claim that the OPR measurements do not pertain to those portions of the observed clouds with temperatures high enough for the OPR to be only at the statistical limit of three or below, which is roughly 40 K.
5. Summary
In this work we have reported quasi-classical trajectory calculations for the H + NH2 H-exchange reaction showing that the reaction occurs without a barrier and with a low-temperature rate coefficient of approximately 1 × 10⁻¹⁰ cm3 s-1. This result is of importance because the H + NH2 H-exchange reaction was introduced for the first time in astrochemical models in Persson et al. (2016) in order to allow the NH2 OPR to tend towards the high thermal ratio at low temperatures as a function of time, with the greatest effect at steady state. Therefore, this calculation appears to confirm that suggestion. Indeed, as shown here, even lower rate coefficients for the H + NH2 H-exchange reaction can still raise the NH2 OPR so that it comes closer to the high thermal ratio at low temperatures.
However, in this study, we included new rate coefficients and processes for the destruction of NH2 by reactions with atomic oxygen and nitrogen. This inclusion has decreased the calculated NH2-OPR value as a function of temperature and timescale to values closer to those obtained before we included the H + NH2 H-exchange reaction by destroying the NH2 at a faster rate than the exchange process. As a result, the NH2-OPR calculations can no longer reproduce those values obtained for sources where they are observed to be greater than three. We have found several methods to turn the thermalization of NH2 back on, and so reproduce these observed data. One possibility is to increase the amount of atomic hydrogen in the gas phase. This can be done in a variety of ways. One method is to change the initial abundance of hydrogen from purely H2 to purely atomic hydrogen, while a more physically reasonable approach is to start with a mixture that is half atomic and half molecular hydrogen. These methods are used in Models 3, 4 and 7, and tend to be successful at early times before a few 105 yr after which the initial atomic hydrogen is mainly converted to its molecular form. We also investigated the impact of varying the cosmic-ray ionization rate, and found that increasing the cosmic-ray ionization rate increases the abundance of atomic hydrogen, improves the H + NH2 reaction efficiency, and consequently the thermalization of the NH2 OPR at low temperatures. Furthermore, the use of this second method complements the first approach since the impact of the ionization rate variation starts to affect the hydrogen abundance at a few 104 yr, increasing the thermalization of the NH2 OPR with increasing time. Models 1′ and 5 to 7 contain cosmic ray ionization rates higher than the standard value.
The two methods used here to increase the abundance of the atomic hydrogen in the gas phase are of course not the only ways to do so. For instance, we could decrease the efficiency of the formation of H2 on grain surfaces, as suggested by Cuppen et al. (2006). Yet another approach would be to increase the standard low-metal C/O abundance ratio from 0.6 to higher values by lowering the oxygen abundance, and so reducing the destruction rate of NH2 by oxygen.
Because the temperatures of the sources studied here are not well determined, the nature of the agreement between observations and our calculations is the degree to which the ranges of temperatures corresponding to the observed and calculated OPR values overlap at physically reasonable timescales. In general, this agreement is reasonable for observed OPR values both below and above three for models that include some degree of NH2-OPR thermalization, as can be seen in Table A.1. Furthermore, our modeled temperature ranges are smaller than the observed ones which could indicate that measuring the NH2-OPR in each environment could help to constrain its temperature to smaller ranges towards the lower values. But there is one major omission in our nearly pure gas-phase treatment and that is the role of ortho-to-para conversion on granular surfaces. As already mentioned in Persson et al. (2016), the efficiency of this phenomenon will depend on the time of residence of each species on the grain, on the shape of the grain surface, and on the time of nuclear-spin conversion. However, the characteristic nuclear-spin conversion times on grain surfaces are not yet well constrained (Le Bourlot 2000; Chehrouri et al. 2011; Hama & Watanabe 2013). So it should be very interesting to explore ortho-para conversion on grain surfaces, as reported by Bron et al. (2016) for the H2 OPR.
Acknowledgments
We thank our anonymous referee for his/her comments that improved the manuscript. R.L. and E.H. acknowledge the support of the National Science Foundation (US) for his astrochemistry program, and support from the NASA Exobiology and Evolutionary Biology program through a subcontract from Rensselaer Polytechnic Institute. C.X. and H.G. thank US Department of Energy for financial support (Grant No. DE-FG02-05ER15694). A.L. acknowledge partial support from the Scientific Foundation of Northwest University (Grant No. 338050068).
References
- Asplund, M., Grevesse, N., Sauval, A. J., & Scott, P. 2009, ARA&A, 47, 481 [NASA ADS] [CrossRef] [Google Scholar]
- Bacmann, A., Caux, E., Hily-Blant, P., et al. 2010, A&A, 521, L42 [NASA ADS] [CrossRef] [EDP Sciences] [Google Scholar]
- Barlow, M. J., Swinyard, B. M., Owen, P. J., et al. 2013, Science, 342, 1343 [NASA ADS] [CrossRef] [PubMed] [Google Scholar]
- Bron, E., Le Petit, F., & Le Bourlot, J. 2016, A&A, 588, A27 [NASA ADS] [CrossRef] [EDP Sciences] [Google Scholar]
- Brünken, S., Sipilä, O., Chambers, E. T., et al. 2014, Nature, 516, 219 [NASA ADS] [CrossRef] [PubMed] [Google Scholar]
- Caselli, P., Walmsley, C. M., Terzieva, R., & Herbst, E. 1998, ApJ, 499, 234 [NASA ADS] [CrossRef] [Google Scholar]
- Chehrouri, M., Fillion, J.-H., Chaabouni, H., et al. 2011, Phys. Chem. Chem. Phys., 13, 2172 [NASA ADS] [CrossRef] [Google Scholar]
- Crabtree, K. N., Indriolo, N., Kreckel, H., Tom, B. A., & McCall, B. J. 2011, ApJ, 729, 15 [NASA ADS] [CrossRef] [Google Scholar]
- Cuppen, H. M., Morata, O., & Herbst, E. 2006, MNRAS, 367, 1757 [NASA ADS] [CrossRef] [Google Scholar]
- Daranlot, J., Hincelin, U., Bergeat, A., et al. 2012, Proc. Nat. Acad. Sci., 109, 10233 [Google Scholar]
- Daranlot, J., Hu, X., Xie, C., et al. 2013, Phys. Chem. Chem. Phys., 15, 13888 [NASA ADS] [CrossRef] [Google Scholar]
- De Luca, M., Gupta, H., Neufeld, D., et al. 2012, ApJ, 751, L37 [NASA ADS] [CrossRef] [Google Scholar]
- Dislaire, V., Hily-Blant, P., Faure, A., et al. 2012, A&A, 537, A20 [NASA ADS] [CrossRef] [EDP Sciences] [Google Scholar]
- Dransfeld, P., & Wagner, H. G. 1987, Z. Phys. Chem., 153, 89 [CrossRef] [Google Scholar]
- Emprechtinger, M., Lis, D. C., Rolffs, R., et al. 2013, ApJ, 765, 61 [NASA ADS] [CrossRef] [Google Scholar]
- Faure, A., Hily-Blant, P., Le Gal, R., Rist, C., & Pineau des Forêts, G. 2013, ApJ, 770, L2 [NASA ADS] [CrossRef] [Google Scholar]
- Fazio, G. G., Lada, C. J., Kleinmann, D. E., et al. 1978, ApJ, 221, L77 [NASA ADS] [CrossRef] [Google Scholar]
- Flagey, N., Goldsmith, P. F., Lis, D. C., et al. 2013, ApJ, 762, 11 [NASA ADS] [CrossRef] [Google Scholar]
- Flower, D. R., & Watt, G. D. 1984, MNRAS, 209, 25 [NASA ADS] [Google Scholar]
- Flower, D. R., Pineau des Forêts, G., & Walmsley, C. M. 2006a, A&A, 456, 215 [NASA ADS] [CrossRef] [EDP Sciences] [Google Scholar]
- Flower, D. R., Pineau des Forêts, G., & Walmsley, C. M. 2006b, A&A, 449, 621 [NASA ADS] [CrossRef] [EDP Sciences] [Google Scholar]
- Fuente, A., Cernicharo, J., Roueff, E., et al. 2016, A&A, 593, A94 [NASA ADS] [CrossRef] [EDP Sciences] [Google Scholar]
- Gerin, M., de Luca, M., Lis, D. C., et al. 2013, J. Phys. Chem. A, 117, 10018 [CrossRef] [Google Scholar]
- Gerin, M., Ruaud, M., Goicoechea, J. R., et al. 2015, A&A, 573, A30 [NASA ADS] [CrossRef] [EDP Sciences] [Google Scholar]
- Goicoechea, J. R., Pety, J., Gerin, M., et al. 2006, A&A, 456, 565 [NASA ADS] [CrossRef] [EDP Sciences] [Google Scholar]
- Hajigholi, M., Persson, C. M., Wirström, E. S., et al. 2016, A&A, 585, A158 [NASA ADS] [CrossRef] [EDP Sciences] [Google Scholar]
- Hama, T., & Watanabe, N. 2013, Chem. Rev., 113, 8783 [CrossRef] [Google Scholar]
- Hase, W. L. 1998, in Encyclopedia of Computational Chemistry, ed. N. Allinger (New York: Wiley), 1, 399 [Google Scholar]
- Hily-Blant, P., Maret, S., Bacmann, A., et al. 2010, A&A, 521, L52 [NASA ADS] [CrossRef] [EDP Sciences] [Google Scholar]
- Honvault, P., Jorfi, M., González-Lezana, T., Faure, A., & Pagani, L. 2011, Phys. Chem. Chem. Phys. 13, 19089 [Google Scholar]
- Honvault, P., Jorfi, M., González-Lezana, T., Faure, A., & Pagani, L. 2012, Phys. Rev. Lett., 108, 109903 [NASA ADS] [CrossRef] [Google Scholar]
- Hu, X., Hase, W. L., & Pirraglia, T. 1991, J. Comput. Chem., 12, 1014 [CrossRef] [Google Scholar]
- Hugo, E., Asvany, O., & Schlemmer, S. 2009, J. Chem. Phys., 130, 164302 [NASA ADS] [CrossRef] [PubMed] [Google Scholar]
- Jorfi, M., & Honvault, P. 2009, J. Phys. Chem. A, 113, 10648 [CrossRef] [Google Scholar]
- Le Bourlot, J. 1991, A&A, 242, 235 [NASA ADS] [Google Scholar]
- Le Bourlot, J. 2000, A&A, 360, 656 [Google Scholar]
- Le Gal, R., Hily-Blant, P., Faure, A., et al. 2014b, A&A, 562, A83 [NASA ADS] [CrossRef] [EDP Sciences] [Google Scholar]
- Le Gal, R., Hily-Blant, P., & Faure, A. 2014a, in SF2A-2014: Proc. Annual meeting of the French Society of Astronomy and Astrophysics, eds. J. Ballet, F. Martins, F. Bournaud, R. Monier, & C. Reylé, 397 [Google Scholar]
- Lis, D. C., Pearson, J. C., Neufeld, D. A., et al. 2010, A&A, 521, L9 [NASA ADS] [CrossRef] [EDP Sciences] [Google Scholar]
- Lis, D. C., Bergin, E. A., Schilke, P., & van Dishoeck, E. F. 2013, J. Phys. Chem. A, 117, 9661 [CrossRef] [Google Scholar]
- Ma, J., Zhu, X., Guo, H., & Yarkony, D. R. 2012, J. Chem. Phys., 137, 22A541 [Google Scholar]
- McCarthy, M. I., Rosmus, P., Werner, H.-J., Botschwina, P., & Vaida, V. 1987, J. Chem. Phys., 86, 6693 [NASA ADS] [CrossRef] [Google Scholar]
- Meyer, D. M., & Roth, K. C. 1991, ApJ, 376, L49 [NASA ADS] [CrossRef] [Google Scholar]
- Millar, T. J., Bennett, A., Rawlings, J. M. C., Brown, P. D., & Charnley, S. B. 1991, A&AS, 87, 585 [NASA ADS] [Google Scholar]
- Mookerjea, B., Vastel, C., Hassel, G. E., et al. 2014, A&A, 566, A61 [NASA ADS] [CrossRef] [EDP Sciences] [Google Scholar]
- Mueller, K. E., Shirley, Y. L., Evans, II, N. J., & Jacobson, H. R. 2002, ApJS, 143, 469 [NASA ADS] [CrossRef] [Google Scholar]
- O’Neill, P. T., Viti, S., & Williams, D. A. 2002, A&A, 388, 346 [NASA ADS] [CrossRef] [EDP Sciences] [Google Scholar]
- Ossenkopf, V., Müller, H. S. P., Lis, D. C., et al. 2010, A&A, 518, L111 [NASA ADS] [CrossRef] [EDP Sciences] [Google Scholar]
- Pagani, L., Vastel, C., Hugo, E., et al. 2009, A&A, 494, 623 [NASA ADS] [CrossRef] [EDP Sciences] [Google Scholar]
- Pagani, L., Roueff, E., & Lesaffre, P. 2011, ApJ, 739, L35 [NASA ADS] [CrossRef] [Google Scholar]
- Pagani, L., Lesaffre, P., Jorfi, M., et al. 2013, A&A, 551, A38 [NASA ADS] [CrossRef] [EDP Sciences] [Google Scholar]
- Pagsberg, P. B., Eriksen, J., & Christensen, H. C. 1979, J. Phys. Chem., 83, 582 [CrossRef] [Google Scholar]
- Paul, A. K., & Hase, W. L. 2016, J. Phys. Chem. A, 120, 372 [CrossRef] [Google Scholar]
- Persson, C. M., Black, J. H., Cernicharo, J., et al. 2010, A&A, 521, L45 [NASA ADS] [CrossRef] [EDP Sciences] [Google Scholar]
- Persson, C. M., De Luca, M., Mookerjea, B., et al. 2012, A&A, 543, A145 [NASA ADS] [CrossRef] [EDP Sciences] [Google Scholar]
- Persson, C. M., Olofsson, A. O. H., Le Gal, R., et al. 2016, A&A, 586, A128 [NASA ADS] [CrossRef] [EDP Sciences] [Google Scholar]
- Prasad, S. S., & Huntress, Jr., W. T. 1980, ApJS, 43, 1 [NASA ADS] [CrossRef] [Google Scholar]
- Rist, C., Faure, A., Hily-Blant, P., & Le Gal, R. 2013, J. Phys. Chem. A, 117, 9800 [Google Scholar]
- Schilke, P., Lis, D. C., Bergin, E. A., Higgins, R., & Comito, C. 2013, J. Phys. Chem. A, 117, 9766 [CrossRef] [PubMed] [Google Scholar]
- Spitzer, Jr., L., & Tomasko, M. G. 1968, ApJ, 152, 971 [NASA ADS] [CrossRef] [Google Scholar]
- Townes, C., & Schawlow, A. 1955, Microwave Spectroscopy, Dover Books on Physics (Dover Publications) [Google Scholar]
- van der Tak, F. F. S., Chavarría, L., Herpin, F., et al. 2013, A&A, 554, A83 [NASA ADS] [CrossRef] [EDP Sciences] [Google Scholar]
- Vastel, C., Spaans, M., Ceccarelli, C., Tielens, A. G. G. M., & Caux, E. 2001, A&A, 376, 1064 [NASA ADS] [CrossRef] [EDP Sciences] [Google Scholar]
- Vastel, C., Caselli, P., Ceccarelli, C., et al. 2006, ApJ, 645, 1198 [NASA ADS] [CrossRef] [Google Scholar]
- Wagenblast, R., Williams, D. A., Millar, T. J., & Nejad, L. A. M. 1993, MNRAS, 260, 420 [NASA ADS] [Google Scholar]
- Wakelam, V., Selsis, F., Herbst, E., & Caselli, P. 2005, A&A, 444, 883 [NASA ADS] [CrossRef] [EDP Sciences] [Google Scholar]
- Wakelam, V., Smith, I. W. M., Loison, J.-C., et al. 2013, unpublished [arXiv:1310.4350] [Google Scholar]
- Whyte, A., & Phillips, L. 1983, Chem. Phys. Lett., 102, 451 [NASA ADS] [CrossRef] [Google Scholar]
- Whyte, A. R., & Phillips, L. F. 1984, J. Phys. Chem., 88, 5670 [CrossRef] [Google Scholar]
- Xie, C., Ma, J., Zhu, X., et al. 2014, J. Phys. Chem. Lett., 5, 1055 [CrossRef] [Google Scholar]
- Zhu, X., Ma, J., Yarkony, D. R., & Guo, H. 2012, J. Chem. Phys., 136, 234301 [NASA ADS] [CrossRef] [Google Scholar]
Appendix A: Additional table
Observed and calculated OPR values of NH2 for assorted models with associated temperature ranges. Model 3 is omitted since it is less physically realistic than Model 4 and gives very similar results.
All Tables
Rate coefficients of the H+NH2 exchange reaction with/without the ZPE constraint.
NH2 and NH destruction updates. The updated rates are from the KIDA database with the references given in the last column.
Observed and calculated OPR values of NH2 for assorted models with associated temperature ranges. Model 3 is omitted since it is less physically realistic than Model 4 and gives very similar results.
All Figures
|
Fig. 1 NH2 OPR computed as a function of temperature at thermal equilibrium in black along with the observed OPR values from Persson et al. (2016) in blue, cyan and pink at the lowest values of the observed temperature ranges (Persson et al. 2016). For the sake of clarity the uncertainties of the observed temperatures are omitted. The NH2-OPR statistical value of 3 is represented by the dashed red line. |
| In the text | |
|
Fig. 2 H2 OPR computed as a function of temperature at thermal equilibrium. |
| In the text | |
|
Fig. 3 NH2 OPR as a function of temperature computed: (i) at thermal equilibrium; (ii) with Model 1 at steady state and an earlier time which best fits the observed values; and (iii) with the analytical formulae (3) and (9). The details of Model 1 are described in Sect. 2.3. The observed OPR values from Persson et al. (2016) are represented within their error bars in blue, cyan and pink at the lowest values of the observed temperature ranges (Persson et al. 2016). For the sake of clarity the uncertainties of the observed temperatures are omitted. |
| In the text | |
|
Fig. 4 Minimum energy path (MEP) from the H + NH2 asymptote on the ground potential energy surface (PES) of NH3. |
| In the text | |
|
Fig. 5 Impact of the kp → o rate coefficient of the H + NH2 H-exchange reaction on the NH2 OPR as a function of temperature computed with Model 1 for the physical conditions given in the super title at steady state and an earlier time. The details of Model 1 are described in Sect. 2.3. |
| In the text | |
|
Fig. 6 OPR of NH2 computed as a function of temperature for the physical conditions given in the super title at thermal equilibrium, and at steady state and an early-time for Models 1 and 2. The details of the models can be found in Sects. 2.3 and 3.3, respectively. Note again that the Model 1 result at steady state lies close to the equilibrium result over a wide range of temperatures. |
| In the text | |
|
Fig. 7 Evolution of the abundances of H, N, O, p-NH2 (NH2 in cyan), and o-NH2 (NHH in yellow) computed at 20 K as functions of time with Models 1, 2, 3, and 4. The different models are described in Table 3. |
| In the text | |
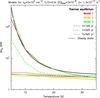 |
Fig. 8 Same as Fig. 6 with the addition of Model 3 and additional timescales. |
| In the text | |
|
Fig. 9 Same as Fig. 8 but with Model 4 results replacing those of Model 1. This figure highlights the impact of the initial chemical condition on the OPR of NH2 as a function of temperature. |
| In the text | |
|
Fig. 10 NH2 OPR computed with Model 2 for different cosmic-ray ionization rates. The NH2-OPR values are plotted at two different times: 1 × 10⁵ yr and at steady state. |
| In the text | |
|
Fig. 11 Evolution of the abundances of H, N, O , p-NH2 (NH2 in cyan) and o-NH2 (NHH in yellow) computed at 20 K with Model 2 as functions of time and for different cosmic-ray ionization rates. The details of Model 2 can be found in Table 3. |
| In the text | |
|
Fig. 12 Calculated OPR of NH2 computed as a function of temperature for a density of nH = 1 × 103 cm-3 for translucent sources. Shown are OPR values for thermal equilibrium and Models 6–7 at assorted times. The hatched boxes represent the OPR measurements from Persson et al. (2016) within their formal errors, for the translucent gas towards W31C found at three different gas velocities. The dotted horizontal lines with arrows mark the lower limits in the translucent gas towards W31C in blue and W49N in pink. The temperature range is limited to 5–35 K even though the observed ranges can be as large as 100 K. See text. |
| In the text | |
Current usage metrics show cumulative count of Article Views (full-text article views including HTML views, PDF and ePub downloads, according to the available data) and Abstracts Views on Vision4Press platform.
Data correspond to usage on the plateform after 2015. The current usage metrics is available 48-96 hours after online publication and is updated daily on week days.
Initial download of the metrics may take a while.