Free Access
Fig. 11
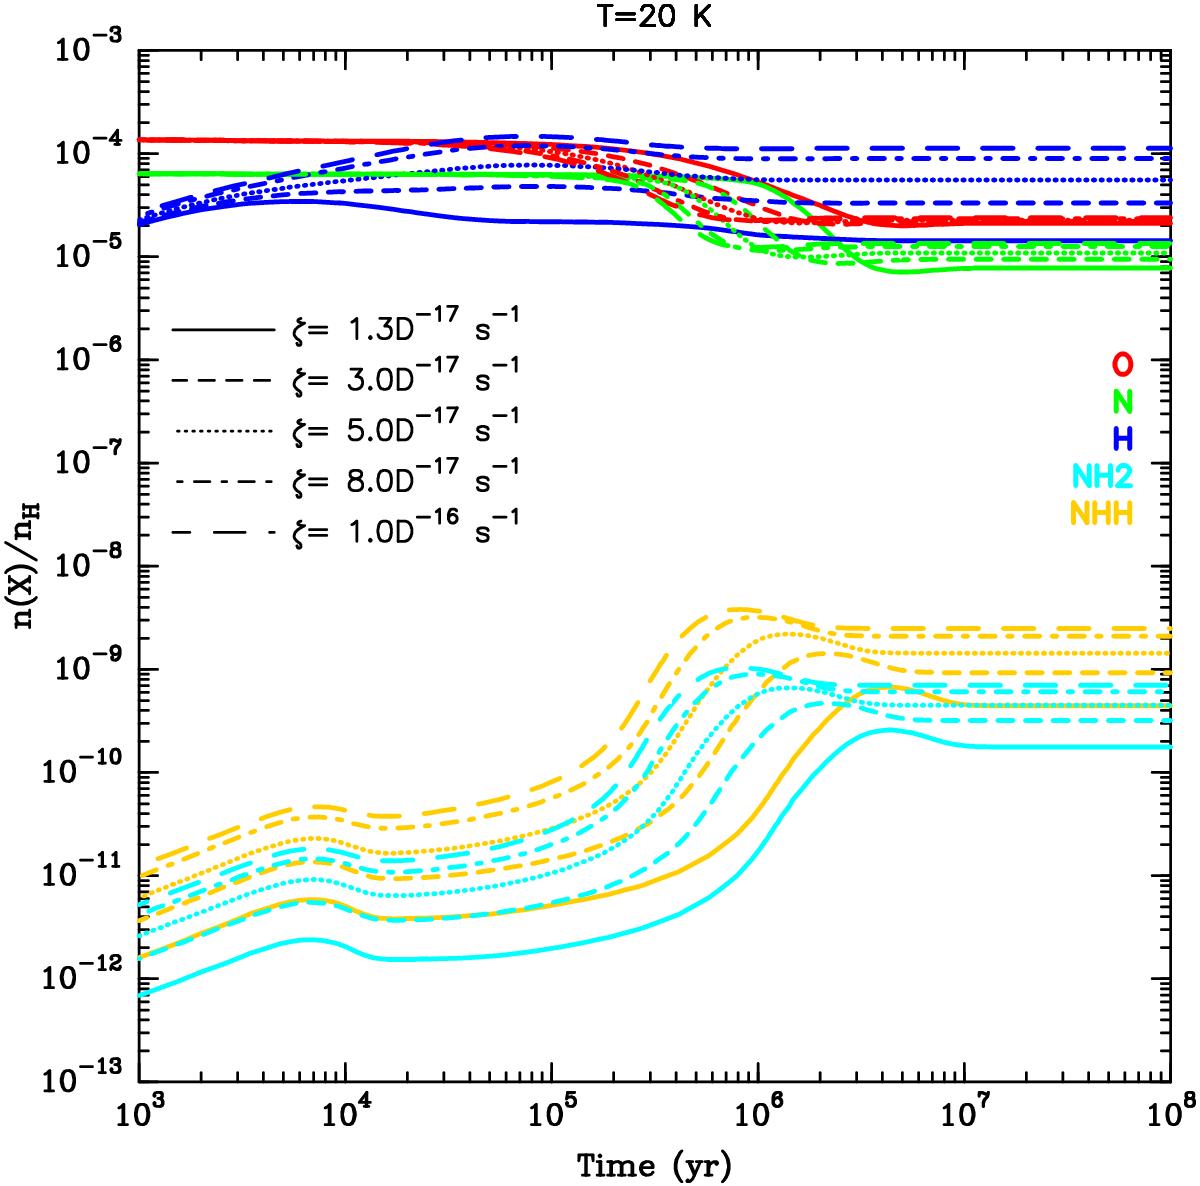
Evolution of the abundances of H, N, O , p-NH2 (NH2 in cyan) and o-NH2 (NHH in yellow) computed at 20 K with Model 2 as functions of time and for different cosmic-ray ionization rates. The details of Model 2 can be found in Table 3.
Current usage metrics show cumulative count of Article Views (full-text article views including HTML views, PDF and ePub downloads, according to the available data) and Abstracts Views on Vision4Press platform.
Data correspond to usage on the plateform after 2015. The current usage metrics is available 48-96 hours after online publication and is updated daily on week days.
Initial download of the metrics may take a while.