Fig. 1
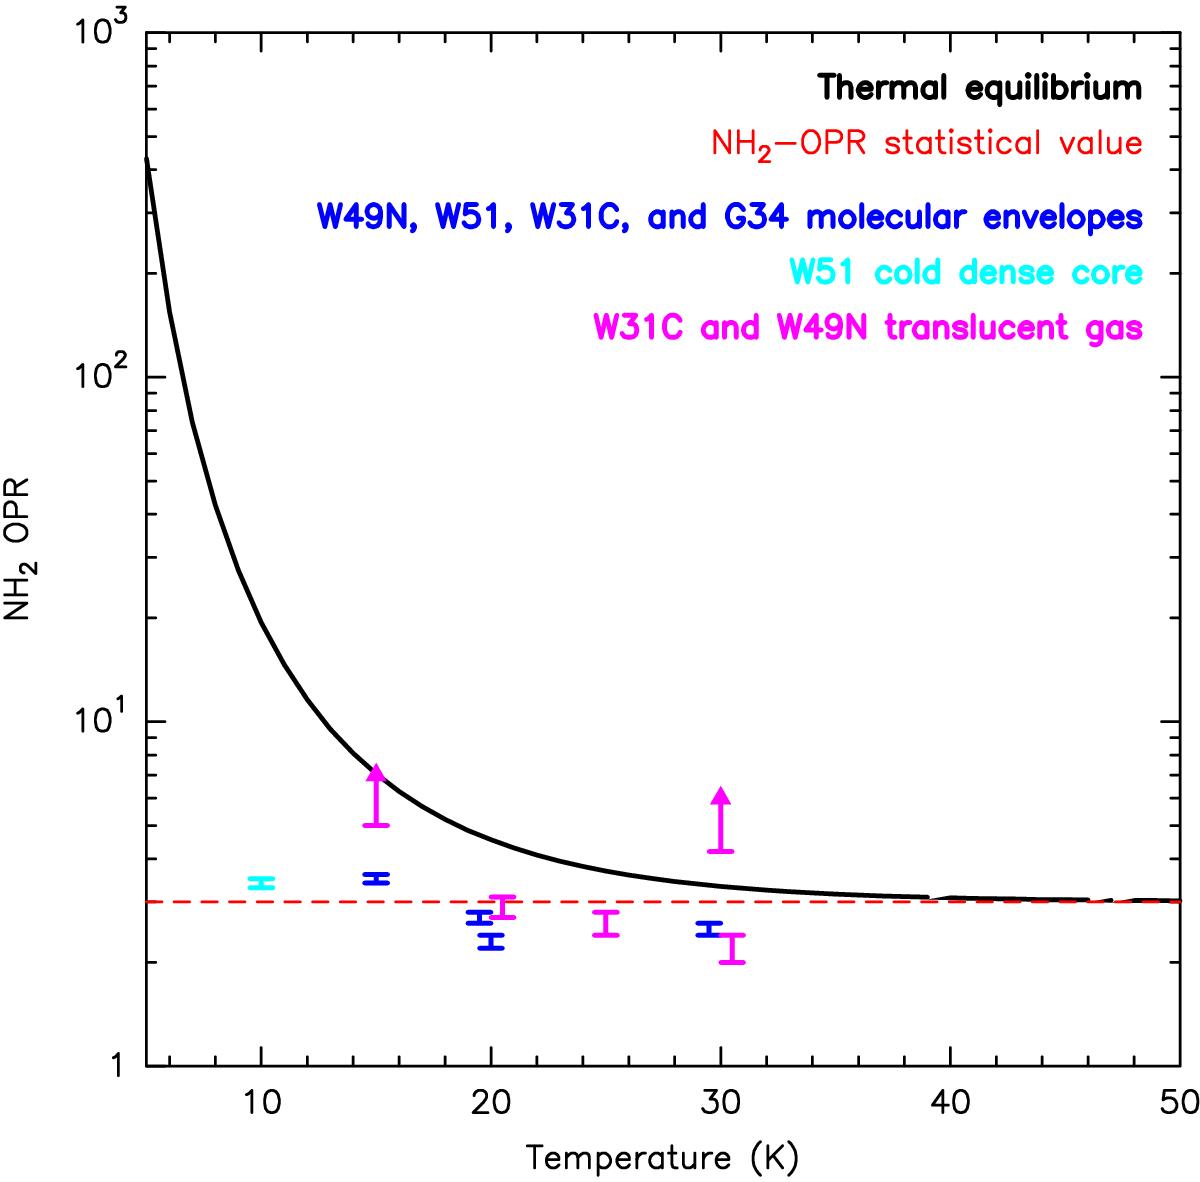
NH2 OPR computed as a function of temperature at thermal equilibrium in black along with the observed OPR values from Persson et al. (2016) in blue, cyan and pink at the lowest values of the observed temperature ranges (Persson et al. 2016). For the sake of clarity the uncertainties of the observed temperatures are omitted. The NH2-OPR statistical value of 3 is represented by the dashed red line.
Current usage metrics show cumulative count of Article Views (full-text article views including HTML views, PDF and ePub downloads, according to the available data) and Abstracts Views on Vision4Press platform.
Data correspond to usage on the plateform after 2015. The current usage metrics is available 48-96 hours after online publication and is updated daily on week days.
Initial download of the metrics may take a while.