Fig. 12
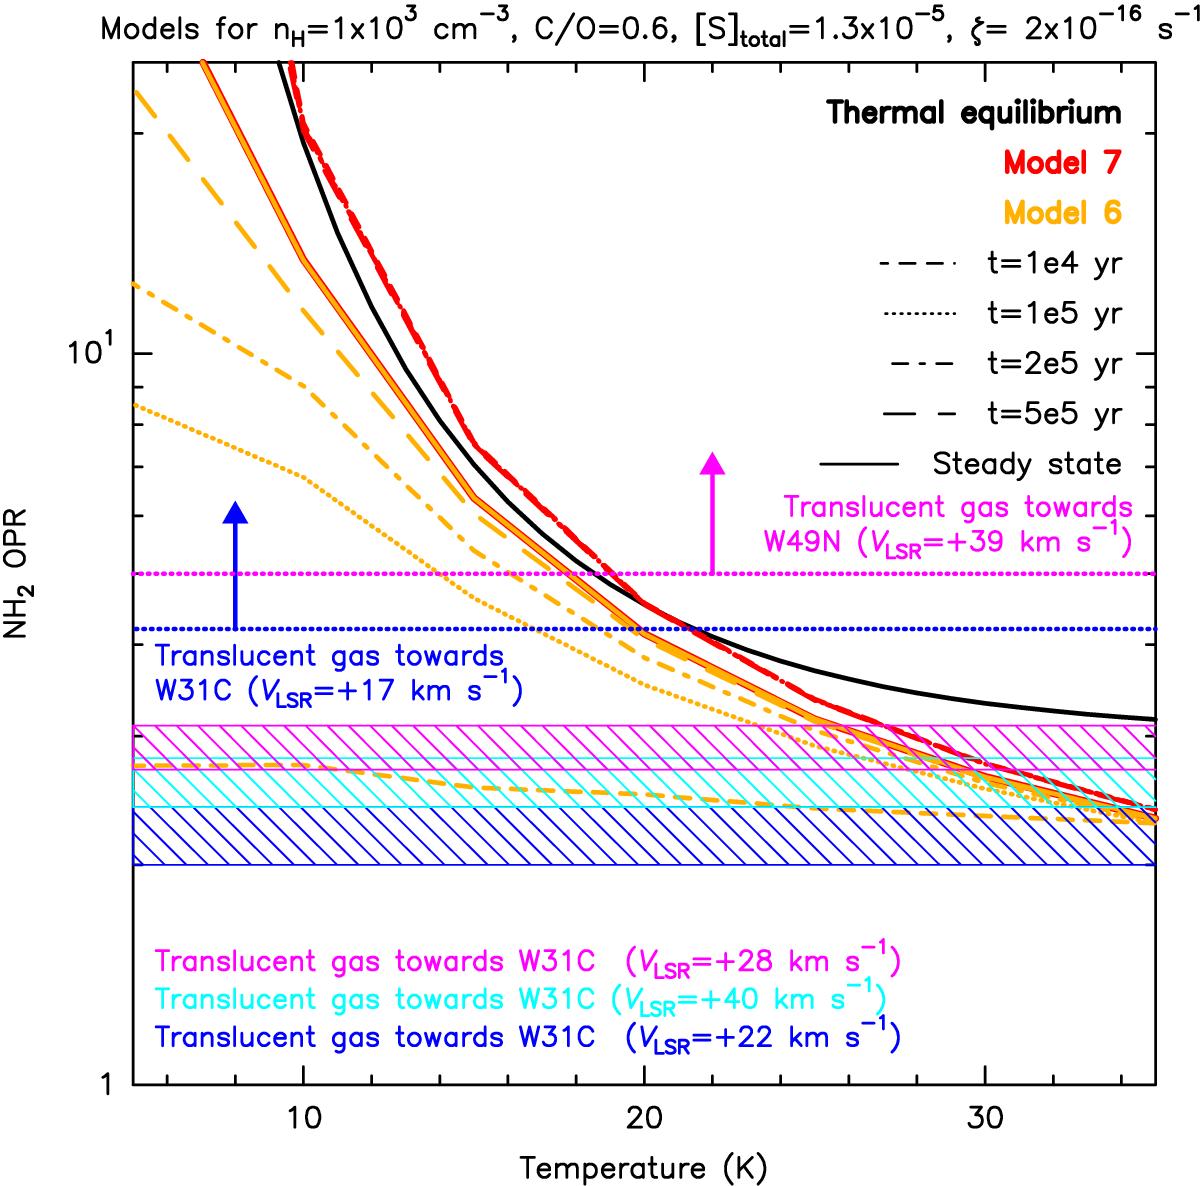
Calculated OPR of NH2 computed as a function of temperature for a density of nH = 1 × 103 cm-3 for translucent sources. Shown are OPR values for thermal equilibrium and Models 6–7 at assorted times. The hatched boxes represent the OPR measurements from Persson et al. (2016) within their formal errors, for the translucent gas towards W31C found at three different gas velocities. The dotted horizontal lines with arrows mark the lower limits in the translucent gas towards W31C in blue and W49N in pink. The temperature range is limited to 5–35 K even though the observed ranges can be as large as 100 K. See text.
Current usage metrics show cumulative count of Article Views (full-text article views including HTML views, PDF and ePub downloads, according to the available data) and Abstracts Views on Vision4Press platform.
Data correspond to usage on the plateform after 2015. The current usage metrics is available 48-96 hours after online publication and is updated daily on week days.
Initial download of the metrics may take a while.