| Issue |
A&A
Volume 593, September 2016
|
|
|---|---|---|
| Article Number | A31 | |
| Number of page(s) | 11 | |
| Section | The Sun | |
| DOI | https://doi.org/10.1051/0004-6361/201628734 | |
| Published online | 05 September 2016 | |
Unexpected spatial intensity distributions and onset timing of solar electron events observed by closely spaced STEREO spacecraft
1 Institut für Experimentelle und
Angewandte Physik, Universität Kiel, 24118
Kiel,
Germany
e-mail: klassen@physik.uni-kiel.de
2 SRG, Universidad de
Alcalá, Dpto. de Física y
Matemáticas, 28871
Alcalá de Henares,
Spain
Received:
18
April
2016
Accepted:
18
May
2016
We present multi-spacecraft observations of four solar electron events using measurements from the Solar Electron Proton Telescope (SEPT) and the Electron Proton Helium INstrument (EPHIN) on board the STEREO and SOHO spacecraft, respectively, occurring between 11 October 2013 and 1 August 2014, during the approaching superior conjunction period of the two STEREO spacecraft. At this time the longitudinal separation angle between STEREO-A (STA) and STEREO-B (STB) was less than 72°. The parent particle sources (flares) of the four investigated events were situated close to, in between, or to the west of the STEREO’s magnetic footpoints. The STEREO measurements revealed a strong difference in electron peak intensities (factor ≤12) showing unexpected intensity distributions at 1 AU, although the two spacecraft had nominally nearly the same angular magnetic footpoint separation from the flaring active region (AR) or their magnetic footpoints were both situated eastwards from the parent particle source. Furthermore, the events detected by the two STEREO imply a strongly unexpected onset timing with respect to each other: the spacecraft magnetically best connected to the flare detected a later arrival of electrons than the other one. This leads us to suggest the concept of a rippled peak intensity distribution at 1 AU formed by narrow peaks (fingers) superposed on a quasi-uniform Gaussian distribution. Additionally, two of the four investigated solar energetic particle (SEP) events show a so-called circumsolar distribution and their characteristics make it plausible to suggest a two-component particle injection scenario forming an unusual, non-uniform intensity distribution at 1 AU.
Key words: Sun: flares / Sun: particle emission / acceleration of particles
© ESO, 2016
1. Introduction and motivation
Previous single spacecraft (s/c) observations and propagation models of solar energetic particle (SEP) events suggest a relatively simple and uniform particle intensity distribution not only at 1 AU but also close to the Sun (e.g., Kallenrode 1993; Strauss & Fichtner 2015). A symmetric Gaussian intensity distribution is assumed with a maximum on field lines connecting to the source (flare/CME) with a strong intensity decrease perpendicular to the magnetic field or the nominal Parker spiral (e.g., Dröge et al. 2010). However, the real spatial distribution of particles close to the Sun is not known, and the injection distribution is assumed as a point-like or a spatially distributed source (e.g., Dröge et al. 2010).
Recent studies of so-called widespread or circumsolar SEP events (e.g., Dresing et al. 2012, 2014; Wiedenbeck et al. 2013; Lario et al. 2013; Gómez-Herrero et al. 2015) using multi-spacecraft observations by widely separated STEREOs and near-Earth s/c found out that the particle distribution may be very broad up to 360 degrees around the Sun at 1 AU. For the majority of the events the intensity distribution shows a Gaussian-like shape. Nevertheless, the first detection of a SEP spike event at both closely spaced STEREO s/c (Klassen et al. 2015) and a small part of all widespread events reveal strong deviations from a simple-uniform Gaussian intensity distribution at 1 AU (e.g., Wibberenz & Cane 2006; Dresing et al. 2012, 2014; Lario et al. 2013; Dröge et al. 2014; Richardson et al. 2014; Gómez-Herrero et al. 2015).
Since late 2013 through 2014 the two STEREO s/c approached their superior solar conjunctions (occurring in February for STEREO-A (STA) and in May 2015 for STEREO-B (STB)) and the separation angle between both s/c was less than 72°. This unique constellation gives us an opportunity to study more precisely the particle distribution at 1 AU, especially when the parent particle source (e.g. the flaring active region (AR)) is located not far away from the magnetic footpoints of the two s/c or is even located between them. Such a closely spaced s/c constellation makes it possible to investigate how uniform the SEP intensity distribution is at 1 AU when it is examined over relatively narrow angular intervals. In a recent study Klassen et al. (2015) found hints towards a non-symmetric and a non-uniform intensity distribution of electrons with respect to the nominal Parker spiral at 1 AU.
We selected four solar electron events detected with the Solar Electron and Proton Telescopes (SEPT) on board the two STEREO s/c. Two of these events have also been detected by the Electron Proton Helium INstrument (EPHIN) on board SOHO. We present multi-spacecraft electron intensity and anisotropy observations at 1 AU, and we determine the particle onset delay between the two STEREO s/c as well as the delays with respect to the associated type III radio bursts. All presented events reveal an unconventional and unexpected behavior in the spatial intensity distribution and onset timing.
2. Instrumentation
The particle measurements are provided by identical SEPT on board the two STEREO s/c. “SEPT consists of two dual double-ended magnet/foil particle telescopes, which cleanly separate and measure electrons in the energy range from 30–400 keV and protons from 60–7000 keV. Anisotropy information on a non-spinning s/c is provided by the two separate telescopes: SEPT-E looking in the ecliptic plane along the Parker spiral magnetic field both towards and away from the Sun, and SEPT-NS looking vertical to the ecliptic plane towards North and South” (Müller-Mellin et al. 2008). The EPHIN instrument on board the non-spinning SOHO s/c measures amongst others electrons in the energy range 0.25–10.4 MeV (Müller-Mellin et al. 1995). In addition, we use measurements from High Energy Telescope (HET; von Rosenvinge et al. 2008), Plasma and Suprathermal Ion Composition (PLASTIC) solar wind data (Galvin et al. 2008), the STEREO radio and plasma Wave (SWAVES) radio emission spectra (Bougeret et al. 2008), Extrem Ultra Violet Imager (EUVI; Howard et al. 2008), and Magnetometer (MAG) data (Acuña et al. 2008) from the two STEREO s/c.
3. Observations
From a number of SEP events detected at the two STEREO s/c since October 2013 we selected four events representing a specific constellation of flare locations relative to the s/c nominal magnetic Parker spiral footpoints. The nominal Parker spiral and the nominal magnetic footpoints at the solar wind source surface are calculated using the measured solar wind speeds during the onset of the SEP event. During this period the orbital longitudinal separation angle between STA and STB decreases from 72° on 11 October 2013 to 34° on 1 August 2014. We selected SEP events with three different constellations:
-
The flare was situated between the nominal magneticfootpoints of the two STEREO s/c (event on 11 October 2013,Figs. 1 and 2);
-
The flare was situated to the west of both s/c footpoints (25 February 2014, Figs. 5 and 7);
-
The flare was situated very close to both s/c footpoints (two events on 1 August 2014, Figs. 10 and 11).
It is important to mention that the two selected events on 11 October 2013 (Sect. 3.1) and on 25 February 2014 (Sect. 3.2) represent so-called widespread or circumsolar particle events (e.g., Dresing et al. 2012; Gómez-Herrero et al. 2015). Both events are detected at all three widely separated locations of STA, STB, and SOHO and show a very broad longitudinal particle distribution.
3.1. The 11 October 2013 SEP event
The widespread SEP event on 11 October 2013 was detected at STA, STB and SOHO in a broad energy range from a few tens of keV up to ≥1 MeV for electrons and in the range of ≤100 MeV for protons. The location of the STEREO and SOHO s/c is shown in the upper right panel of Fig. 1. The event was associated with an M1.5 X-ray flare which occurred ~10° behind the east solar limb (as seen from Earth). The flare was associated with a full-halo (1200 km s-1) coronal mass ejection (CME), a dome-shaped circular EIT-wave (speed ≥710 km s-1), a coronal type II radio burst starting at 0711 UT at 270 MHz followed by an IP type II radio burst observed by IZMIRAN and SWAVES, respectively.
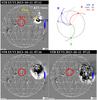 |
Fig. 1 STEREO-B EUVI 195 Å difference images showing the flare location and the evolution of the circular EIT-wave relative to the nominal magnetic footpoints of STA (red) and STB (blue) during the SEP event on 11 October 2013. Top right: longitudinal positions of STA, STB, and Earth/SOHO and the nominal Parker spirals connecting them to the Sun. The arrow indicates the location of the parent flare, the source of the SEP event. The angular separations between the s/c magnetic footpoints and the flare position are inserted in the upper right corner. |
Additionally, the flare was accompanied by an interplanetary (IP) type III radio burst at 0712–0725 UT, starting one minute after the type II burst onset. No type III bursts associated with the impulsive flare stage were observed. Furthermore, the SWAVES instrument at STA detected locally generated Langmuir waves, indicating the arrival of low-energy electrons generating the type III radio emission (not shown). Langmuir waves at STB and at the Wind s/c were not detected. From the STB point of view the flare occurred near N20W40 (Fig. 1), and for STA the flare was ~20° behind the west limb. Figure 1 (top right) presents the locations of the parent flare/AR, STA, STB, SOHO, and the nominal Parker magnetic field spirals connecting the s/c to the Sun, corresponding to the solar wind speeds measured during the electron onset.
Figure 2 shows in the upper panel the time profile of 55 to 65 keV electrons together with the 250–700 keV measurements by EPHIN at L1 from 10 October to 17 October 2014. Unfortunately, because of higher background, ACE at L1 did not detect this event at energies 55–105 keV. The three lower panels show an expanded view including pitch angle (PA) dependent intensity variations. Both STEREO s/c detected a prompt electron increase with a clear velocity dispersion (not shown) followed by a long decay in a broad energy range from tens of keV up to 1 MeV.
Figure 2 (bottom) presents the pitch angle distributions (PADs) as measured at both STA and STB s/c. During the event the STA and STB pitch angle coverage was quite good and the data show clear anisotropic electron fluxes from the event onset and lasting for several hours. Admittedly there are limitations for the pitch angle coverage of the SEPT instrument since it has only four viewing directions. Electron anisotropies at STA and STB show flux increases at the PA closer to 0° and to 180°, respectively, which corresponds to particles propagating from the direction of the Sun but along opposite polarities. These polarities correspond to the open magnetic field distribution presented in Fig. 3 (red denotes negative polarity, green positive polarity). This suggests that the particles were injected into or along different magnetic sectors from the flare/AR site, which lies in projection close to the global heliospheric current sheet as indicated by the white line. This particle event at SOHO was more than two orders of magnitude weaker than at STA (at the same energy of 0.7 MeV, as shown in Fig. 15 ) and was delayed by about 200 min with respect to the other s/c.
Figure 3 presents a synoptic global oscillation network group (GONG) map with open magnetic field lines connecting to the ecliptic plane calculated using the potential field source surface (PFSS) model, overplotted at the solar magnetogram taken on 11 October 2013. The back-mapped locations of the nominal magnetic footpoint of all s/c are displayed as crosses and circles in red, blue, and green for STA, STB, and SOHO, respectively. The circles denote a ±10° uncertainty and the location of the parent flare is marked by a gold diamond.
Although the flare was located nearly in between of the nominal connecting footpoints of STA and STB with an angular separation to the flare of 50° for STA and 49° for STB (see Table 1), the measured peak intensities at STA and STB differ strongly and unexpectedly by a factor of ~12 (Fig. 2). Furthermore, the electron onset at STB is delayed with respect to STA by 13 min, whereas the electron onsets with respect to the associated type III radio bursts are delayed by about 19 and 8 min for STB and STA, respectively (see Sect. 3.4 for the delay calculations).
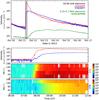 |
Fig. 2 Electron event on 11 October 2013. Top: intensity time profiles detected at STA (red) and STB (blue) showing distinct differences in peak intensities and in the onset times. For comparison the intensity profile at SOHO is shown in green. Bottom: enlarged time profiles and intensity pitch-angle distributions measured by STA and STB (shaded interval on the top). |
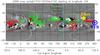 |
Fig. 3 Synoptic magnetic field map from GONG1 showing the PFSS1 open magnetic field lines connecting to the ecliptic plane on 11 October 2013. S/c magnetic nominal footpoints are indicated by circles. STA is shown in red, SOHO in green, STB in blue. The location of the associated flaring AR is indicated by a gold diamond. |
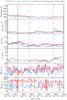 |
Fig. 4 Event on 11 October 2013. Solar wind and magnetic field measurements from 10 to 17 October 2013 (red: STA, blue: STB). From top to bottom: solar wind proton speed, proton density, proton temperature, magnetic field magnitude, magnetic field latitudinal, and longitudinal angles. The vertical solid line marks the SEP onset and the dashed lines mark IP shocks observed at STB. |
3.1.1. In situ plasma and magnetic field observations and IP conditions during the 11 October 2013 event
Figure 4 presents an overview of in situ plasma and magnetic field data as observed by STA and STB from 10 October to 17 October 2013. The panels show from top to bottom the solar wind proton speed, density, temperature, magnetic field magnitude, its latitudinal angle and its azimuthal angle in the RTN coordinate system. During the SEP event, indicated by a solid vertical line, and during the whole time interval the IP environment implies relatively quiet conditions when both s/c were embedded in slow solar wind (Vsw < 380 km s-1) and in relatively quiet magnetic fields. No interplanetary coronal mass ejections (ICMEs) and co-rotating interaction regions (CIRs) were observed during the whole period.
According to the L.K. Jian shock list2 only two weak IP shocks in the slow solar wind speed were detected at STB on 12 October (at 1709 UT) and 15 October (at 1552 UT) marked by dashed lines in Fig. 4. It is not clear whether these shocks were in fact associated with the CME/ICME launched during the SEP related flare, and were indeed en route between the Sun and STEREO and thus were able to modify the IP magnetic field and the nominal propagating path of electrons.
The second shock on 15 October was presumably associated with the SEP parent flare/CME on 11 October. In this case it has no influence on the particle propagation. The first shock on 12 October could be in fact situated between the Sun and the s/c during the event. However, its influence on the particle propagation and on the shape of the Parker spiral was rather small because it appears in slow solar wind and without an ICME signature behind the shock.
During the three days prior to the SEP event only slow CMEs (<520 km s-1) were observed with Large Angle and Spectrometric Coronagraph (LASCO)3 confirming a lack of magnetic disturbances in the IP medium as shown in Fig. 4. All these facts together support the suggestion that during the SEP event the nominal Parker magnetic field structure was not strongly modified by the observed transients and that the estimated nominal STEREO magnetic footpoint positions shown in Fig. 3 corresponded to the actual positions connecting the source surface with both s/c.
In summary: on the one hand, the electron event on 11 October 2013 shows a clear velocity dispersion and anisotropic PADs at the two STEREO s/c implying optimal connections to the parent particle source although the peak intensities at the two s/c differ strongly by a factor of 12. On the other hand, the s/c nominal angular magnetic footpoint separations to the flare were closely comparable by ~50° westward and ~49° eastward, for STA and STB, respectively. The Parker spirals connecting the s/c to the Sun were probably not essentially modified because of the relatively quiet IP conditions. Consequently, the strong peak intensity difference might be explained assuming an expanded source with a strong non-uniform particle distribution below the source surface and in the IP medium. Another possibility might be a strongly non-radial magnetic field structure between the flare and the source surface.
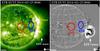 |
Fig. 5 STEREO-B EUVI 195 Å direct (left) and difference images (right) showing the flare location, the dome-shaped EIT-wave, and the coronal hole (CH) in relation to the nominal magnetic footpoints of STA (red) and STB (blue) during the SEP event on 25 February 2014. |
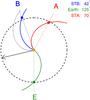 |
Fig. 6 Longitudinal positions of STA, STB, and Earth/SOHO and the nominal Parker spirals connecting them to the Sun. The black arrow indicates the location of the parent flare, the source of the SEP event on 25 February 2014. The angular separations between the s/c magnetic footpoints and the flare position are inserted in the upper right corner. |
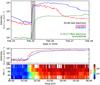 |
Fig. 7 Event on 25 February 2014. Top: electron time profiles detected at STA (red), STB (blue), and SOHO (green). STA shows an earlier onset and higher intensities at the beginning of the event than STB. The spike before the event onset in EPHIN data is due to the hard X-ray contamination. Bottom: enlarged interval (shaded period on the top) of time profiles at STA and STB. The PAD measured by STA shows a clear anisotropy from the event onset until 02:00 UT. PAD data for STB are not available because of a data gap in MAG data. |
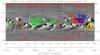 |
Fig. 8 Synoptic magnetic field map from GONG for the event on 25 February 2014. Description as in Fig. 3. |
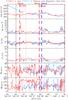 |
Fig. 9 Event on 25 February 2014. Solar wind and magnetic field data as in Fig. 4. SEP onset and IP shocks are indicated by solid and dashed vertical lines, respectively. Magnetic field data from 20 to 26 February and solar wind data from 25 to 27 February were not available. |
3.2. The 25 February 2014 SEP event
The 25 February 2015 SEP event was associated with a X4.9/2B X-ray/Hα flare (start 0039, maximum 0049 UT) appearing close to the solar east limb (Earth view) at coordinates S12E82. Viewed from STB it appears at the west limb (Fig. 5), and viewed from STA the associated flare occurs 40° behind the west limb (Fig. 6).
The flare was accompanied by IP type III and coronal-IP type II radio bursts starting simultaneously at 0145.5 UT, and by a fast asymmetric full-halo CME (speed ≤1780 km s-1) and by a dome-shaped EIT-wave as shown in Fig. 5. The nominal footpoints of STA and STB were situated definitely eastwards from the flare location.
Figure 7 shows the electron intensity time profiles from the two STEREO s/c in the energy range of 55–65 keV measured with the sunwards looking telescopes of SEPT together with the 250–700 keV measurements by EPHIN. Apart from the fact that STB shows an onset that is 13 min later than shown by STA, the shapes of both time profiles are similar to each other from onset on and during the following two hours when the intensity at STA reached its maximum. Afterwards the STA intensity profile decays gradually, while the STB intensity shows a slowly growing profile in the next 15 h which can be explained by an additional acceleration of the approaching IP shock.
Figure 7 (bottom) shows the SEPT/STA PAD with a clear moderate anisotropy from onset through the intensity maximum when the main part of particles streamed from the Sun at PA 180°. The PAD for STB is not available owing to a lack of magnetic field data.
A synoptic magnetic field map from GONG showing the PFSS open magnetic field lines connecting to the ecliptic plane is presented in Fig. 8. S/c nominal footpoints are indicated by circles (STA in red, SOHO in green, STB in blue). The location of the flaring AR is marked by a diamond. The footpoints of both STEREO s/c are situated eastward from the flaring AR; STA is farther away than STB. Nevertheless, the particle onset at STA was 13 min earlier and the intensity during the first hours was higher and peaked at 0250 UT, clearly earlier than at STB as shown in Fig. 7. The onset delay with respect to type III bursts is 10, 24, and 78 min for STA, STB, and SOHO, respectively. This means – if we take only the STEREO observations – that the particles arrived and peaked first at the STA s/c, which was farther away (separation to the flare 70°), and then at the nominally best connected STB with a separation of 42°.
Figure 9 presents in situ plasma and magnetic field data measured by the two STEREO s/c from 24 February to 3 March. The onset of the SEP event is indicated by the solid line. It occurs during different interplanetary conditions for the two STEREO s/c. During the SEP onset at 0109 UT STA was situated in a slow solar wind stream (370 km s-1) followed by a weak IP shock at 1216 UT and an ICME, while STB was situated inside a high-speed stream (570 km s-1). The high-speed stream very likely originated from the coronal hole (CH) situated close to the STB footpoint as shown in Fig. 5. The ICME detected at STA and not at STB might change the IP magnetic field connecting STA with the Sun and might shift the nominal footpoint to the west, i.e. closer to the flare. On the other hand, because this ICME was not detected at STB its extent was obviously not large and the shift was likely not essential.
Although the SEP associated CME was not directed towards the Earth/STA/STB, it drove an IP shock that possible overtook all three s/c: SOHO at 1617 UT on 27 February, STA at 2046 UT on 27 February, and STB at 0423 UT 28 February. Consequently the shock angular width was at least ≥207° because the separation angle between STA and SOHO/L1 was 207° and the flare/CME was located in between. As far as we know from the literature it could be the broadest IP shock ever observed because, according to Cane (1996), the longitudinal extent of IP shocks at 1 AU is at most 180°. On the other hand, there is an uncertainty of the shock origin at STA (Lario et al. 2016).
We note that STB was longitudinally the closest s/c to the flare/CME origin, but radially it was the farthest one from the Sun, at a distance of 1.07 AU. STA was at a distance of 0.96 AU and SOHO at 0.98 AU. From the shock arrival time and the s/c radial distances we estimate the averaged shock transit speed of 598, 597 and 653 km s-1 for STB, STA and SOHO, respectively. These speeds are significantly smaller than the CME speed of 1809 km s-1 close to the Sun suggesting a strong deceleration en route to 1 AU.
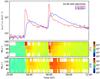 |
Fig. 10 Events on 1 August 2014. Electron intensity time profiles detected at STA (red) and STB (blue). During both events STA shows an earlier onset, higher intensity, and stronger anisotropy than STB. |
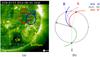 |
Fig. 11 a) STEREO-B EUVI 195 Å image showing the jet/flare location in relation to the nominal magnetic footpoints of STA (red) and STB (blue) and the CH associated with the SEP events on 1 August 2014. b) The same as in Fig. 1. |
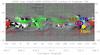 |
Fig. 12 Synoptic magnetic field map from GONG for events on 1 August 2014. Description as in Fig. 3. |
3.3. The 1 August 2014 events
Figure 10 presents two consecutive SEP events detected at STA and STB separated by seven hours. The time profiles of the two events are very similar at each s/c, but differ strongly from s/c to s/c. The SEPs originated from two small homologous flares accompanied by recurrent long and narrow EUV jets appearing in the same AR at coordinates S22W55 as seen from STB (Fig. 11), and were slightly behind the west and east limb from STA and SOHO/Earth point of view, respectively. The jets were about 1 solar radius long with prolongation into the coronograph (COR1) field of view (FOV) without any signatures in the COR2 FOV. Both SEP events were not associated with CMEs and EIT-waves or with type II radio bursts. They were accompanied merely by strong IP type III bursts as observed at STA/STB/WIND s/c, and the first one was also accompanied by a very weak coronal type III burst as observed by the ground based CALLISTO network (not shown). It should be mentioned, that the type III burst associated with the first event starting at 1622 UT (event I) was delayed relative to the jet appearance at 1613 UT by 9 min. At event II, the delay between the jet at 2316 UT and the type IIIs at 2324 UT was 8 min.
As shown in Fig. 10, STA measured two anisotropic impulsive events with sharp peaks and clear velocity dispersions (not shown). STB detected less impulsive profiles with poor velocity dispersions, smoothed maxima, and more prolonged decay phases. Although the first electrons reach the two s/c at the same pitch angle of 0°, in agreement with magnetic field polarity shown in Fig. 12, the PAD measured at STA is more anisotropic from the onset to the maximum, in contrast to STB.
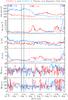 |
Fig. 13 Events on 1 August 2014. Solar wind and magnetic field data. SEP onset and CIRs are indicated by solid and dashed vertical lines, respectively. |
Figure 12 presents the GONG synoptic magnetic field map showing the s/c backmapped magnetic footpoints and the location of the flare/jet associated with the SEP events. The angular separation between the flare/jet and the nominal footpoints of each s/c was relatively small, 27° for STA and 18° for STB, suggesting that the two s/c were similarly well connected to the parent source. At the same time, the magnetic footpoint of STB is slightly closer to the jet’s location than STA. The exact actual location of the footpoints at the Sun’s surface is generally difficult to estimate especially owing to the lack of knowledge of the magnetic field distribution below the source surface. Nevertheless, the relative positions of the flare, STB, and STA are aligned from southwest to northeast. The solar wind data and EUV observations confirm that this is also the ordering of the magnetic connections. Figure 13 presents the solar wind data and shows that on 1 August STB was situated inside a fast solar wind clearly streaming from the south CH (Fig. 11a). The same stream had already overtaken the STA s/c two to three days earlier, corresponding to the nominal longitudinal separation between STA and STB of 34°. The estimated nominal STB footpoint, shown in Figs. 11 and 12, is located outside the CH. However, it is plausible to suggest that the actual STB footpoint is located farther southwards from the estimated location, i.e., close to the edge or inside of the south pole CH in agreement with the measured solar wind speed between 561–588 km s-1 (Table 1). Such a shift could explain the observed high-speed solar wind stream flowing from the south CH (see Fig. 13). Consequently, we claim that during both SEP events the real STA footpoint was at the same distance or even farther away from the parent source than the STB footpoint. Nevertheless, against the expectation, STA detected a higher electron peak intensity, an earlier and a more impulsive onset, and a higher anisotropy than STB.
On the one hand the strong difference in onset timing and intensity profiles for the s/c situated outside and inside of the CH might be explained by different propagation conditions along the paths towards STA and STB. On the other hand a mechanism shielding the penetration of electrons into CH regions and into high-speed stream could also cause the observations.
3.4. Onset time delays: between STA and STB and relative to type III radio bursts
To determine the onset time delay between the in situ measured nearly relativistic 55–65 keV electrons and type III radio bursts we used the solar release time. The inferred release time of electrons at the Sun is the measured onset time shifted back by the electron propagation time along the nominal Parker spiral whose length depends on the solar wind speed measured during the SEP onset. The release time of the type III burst at the Sun is the observed onset of the 16 MHz emission at the s/c shifted back by the propagation time of electromagnetic emission from the Sun to the s/c. We assume that the electron injection was coincident with decametric-hectometric (DH: 1–16 MHz) type III onsets (e.g., Kahler et al. 2007) as observed by SWAVES and that both the low-energy electrons responsible for type III generation and the nearly relativistic electrons belong to the same particle population.
Each of the four particle events detected at STA and at STB shows an onset delay relative to the associated type III burst onset and relative to each other as well. The onset delays between s/c and type IIIs range between nearly 0 and 24 min and the onset delays between the two s/c range between 13 and 20 min (Table 1). At the same time the larger the delay between STA and STB, the larger the intensity difference between the two s/c.
The electron delays with respect to type IIIs imply that the effective propagation paths from the Sun to the s/c should be substantially larger than the path along the nominal Parker spiral of ~1.2 AU and range between 1.2–2.5 AU. These larger propagation paths are in agreement with the values found in previous investigations (e.g., Ragot 2006; Kahler et al. 2011; Klassen et al. 2015). Furthermore, the onset delays at STB relative to STA provide the difference in propagation path lengths between the two s/c ranging between ~0.7–1.0 AU, suggesting that the particles reach the two s/c along strongly different paths or propagation conditions. Figure 14a presents the SEP onset delays as a function of the magnetic footpoint separation for the four presented events and for an additional event on 2 May 2014 (Klassen et al. 2015). All five events in our sample show a behavior different from the expectation: the nominally best connected s/c always detected lower peak intensity and a larger onset delay than the nominally farther separated s/c (taking into account the two STEREO s/c only).
It should be noted that there are still alternative ideas that try to explain the delayed arrival of electrons because of delayed injection of nearly relativistic electrons relative to type III generating electrons (Krucker et al. 1999; Haggerty & Roelof 2002; Klassen et al. 2002; Cane 2003; Wang et al. 2006).
3.5. Angular and longitudinal intensity distribution: two- and three-spacecraft events
Figure 14b presents the peak intensity distribution relative to the angular separation between the s/c footpoints and the parent flare measured in the energy range of 55–65 keV. The peak intensities are normalized to the smallest peak for each event and the pre-event background is subtracted. As STB is normally 0.03–0.11 AU farther away from the Sun than STA the peak intensity at STB adjusted to 1 AU could be higher by 5–20%. In addition to the four discussed events we added the SEP event observed on 2 May 2014 (Klassen et al. 2015), which also belongs to the category of events detected by closely spaced s/c. We note that, we take the angular separation instead of longitudinal separation used in previous studies (e.g., Lario et al. 2013; Dresing et al. 2014) because at relatively small footpoint separations between two s/c (≤70°), the angular separation reflects more precisely the actual angular distance between the s/c and the flare.
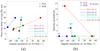 |
Fig. 14 a) Onset time delays of 55–65 keV electrons relative to the type III radio burst onset vs. angular separation between the parent flare and s/c footpoints as observed by STA (Λ) and STB (◯). b) Angular distribution of peak electron intensities normalized to the smallest peak. The pre-event background is subtracted. The letter (F) indicates the s/c that detected the event onset first. The difference in radial distance to the Sun for each s/c is not taken into account; therefore, the values for STB could be 10−20% higher. We note that the first two events (red and blue) are widespread and the third one (green) is a spike event. |
The presented distributions are strongly unexpected. We would expect a linear or an exponential decrease in the peak intensity with increasing separation to the parent source, assuming that the ejected particles build up an approximately symmetric distribution (e.g. Gaussian-like) around the optimal connecting field line to the source (e.g., Strauss & Fichtner 2015). Instead, all the presented events show a deviating pattern. In events where the s/c separations to the flare differ, we find nearly identical intensities (SEPs on 25 February 2014 and 2 May 2014), and in events with comparable s/c separations to the flare, we find strongly deviating intensities (remaining three events).
Furthermore, although both STA and STB footpoints were located to the east of the flare position during three events, one on 25 February 2014 with separation from the flare of 70° and 42°, and events I/II on 1 August 2014 with separation of 27°/ 26° and 18°/22° for STA and STB, respectively, the electrons arrive first and peak earlier with comparable or higher peak intensities at the farthest one, STA s/c. We note that the STB peak intensity on 25 February 2014 event is not unambiguously determined because the intensity profile after the rising phase (Fig. 7) shows a flat-rising profile, which is probably caused by additional acceleration of the approaching IP shock. Therefore, the STB peak in Fig. 14b is tagged with an error bar.
Figure 15 shows the typical presentation of the angular distribution of background-corrected peak intensities as measured at three locations around the Sun in comparable energy ranges at HET/STA and HET/STB (0.7–2.8 MeV), and EPHIN/SOHO at L1 (0.7–3.0 MeV). The observations are fitted by a symmetric Gaussian with a standard deviation of σ = 45° and σ = 47° for the widespread events on 11 October 2013 (a) and on 25 February 2014 (b), respectively. After pre-event background subtraction we applied a dividing factor of 13 to the 0.7–3.0 MeV electron intensities measured by SOHO/EPHIN according to Lario et al. (2013). The strong difference in intensities measured by STA and STB during the event on 11 October 2013 when footpoints of the both s/c were approximately equally separated from the flare makes it practically impossible to provide a reasonable symmetric Gaussian fit centered on 0°. Indeed, the measured peak intensities imply a non-symmetric distribution in contrast to results found elsewhere (e.g., Dresing et al. 2014; Richardson et al. 2014; Strauss & Fichtner 2015). The SEP on 25 February 2014 shows a different behavior. At higher energies of 0.7–3.0 MeV, the Gaussian fit reasonably matches the peak intensities; however, this is not the case for the lower energies of 55–65 keV (Fig. 14b) where the peak intensities at STA and STB are comparable. This indicates that the mechanism responsible for the longitudinal spreading of electrons accelerated in SEP events might be energy dependent.
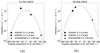 |
Fig. 15 Angular distribution and Gaussian fits to the peak intensities of 0.7–2.8 MeV electrons measured at HET/STA (■) and HET/STB (•), and 0.7–3.0 MeV electrons at EPHIN/SOHO (▴) for the events on 11 October 2013 (a) and 25 February 2014 (b). Negative separation angles denote the s/c magnetic footpoint to the east from the flare. The pre-event background has been subtracted. |
3.6. Observational results
The studied SEP events were observed during relatively small longitudinal separations of <72° between the two STEREO s/c and during different spatial constellations of parent flare location with respect to nominal Parker spirals connecting the s/c to the Sun. The most important information of the events is summarized in Table 1. All four events show an unexpected intensity distribution and an unexpected relative onset timing at both s/c. Two studied events belong to so-called widespread SEP events and were additionally detected at SOHO at the L1 location. The observational results can be summarized as follows:
-
Generally for all four STEREO events the worst connected s/c (i.e., the farthest away) measured intensities that were similar to or higher than measured at the closest one, as shown in Fig. 14b. The strongest difference in peak intensities is of factor 12 as measured by STA and STB on 11 October 2013, although the footpoints of both s/c had the same angular separation to the flare.
-
All four events show a strongly unexpected relative onset timing at both STEREO s/c: The s/c nominally closest to the flare detected a later SEP onset than the farthest one with time delays up to 20 min (Fig. 14a and Table 1). Furthermore, in three events on 25 February 2014 and on 1 August 2014 (event I and II), although the footpoints of both STEREO s/c were located to the east of the flare position, the electrons arrive first and peak earlier at the farthest s/c (STA). All four events with higher peak intensity also show an earlier onset.
-
The effective length of the electron propagation paths from the Sun to both s/c reveals large differences up to 0.6 AU, although the orbital longitudinal separation between STA and STB was relatively small (between 72° and 34°).
-
The widespread event on 11 October 2013 shows an asymmetric, non-Gaussian peak intensity distribution (Fig. 15).
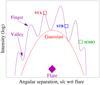 |
Fig. 16 Proposed spatial peak intensity distribution of SEP events at 1 AU vs. angular separation of the s/c with respect to the flare. |
4. Discussion
It has been shown for all presented SEP events that the angular peak intensity distribution at 1 AU does not show the usual Gaussian distribution. This result together with the unexpected onset timing at both closely spaced STEREO s/c poses a challenge to each model and scenario suggested in previous studies (see e.g., the introduction in Gómez-Herrero et al. 2015).
Therefore, we propose a scenario containing a Gaussian-like intensity distribution (approximately uniform) superimposed by fringes or fingers. Figure 16 shows an intensity contour plot explaining the idea. In contrast to a simple Gaussian distribution such a combined distribution could explain the observed peak intensities and onset delays and may be valid not only for SEP events with relatively small angular extent but also on larger angular scales during widespread or circumsolar events. Depending on the location of each individual s/c relative to the fingers, i.e. at the fingertip or between them, the measured intensity could be very different even for closely spaced s/c with a relatively small separation from each other.
The origin of fingers and valleys is not clear yet; they might be caused by different phenomena in the corona, possibly occurring mainly below the source surface. We propose that the open magnetic fields from the flaring region prolonged into the IP medium provide a prompt access of energetic particles into the IP medium, and form the fingers. Consequently, the s/c situated on the fingers detect not only a higher intensity, but also an earlier SEP onset. The valleys between the fingers could be formed by large-scale “closed” magnetic fields around the ARs, and/or by the CHs and the high-speed streams with a stronger turbulence and consequently with a higher scattering (e.g., Fig. 11 in Dresing et al. 2014; Crooker et al. 1999). In this case the CHs, the high-speed streams and the stream interfaces could play the role of diffusion barriers, inhibiting the perpendicular diffusion and partially shielding the penetration of particles inside these regions.
Additionally, there are also other scenarios mentioned in previous studies (e.g., Kallenrode 1993; Dresing et al. 2012, 2014; Lario et al. 2014; Klassen et al. 2015) that could be responsible for the finger-valley distribution:
-
a strong deviation of the interplanetary magnetic field from the nominal Parker spiral. For example, an en route CME/ICME may significantly displace the optimal magnetic connection to the source towards the s/c detecting the highest intensity. This implies that the normally used backmapping method for the magnetic field connecting the s/c to the Sun, i.e. the nominal Parker spiral, is not valid at least for the presented events observed by closely spaced s/c;
-
a fan-shaped, strongly tilted and non-radial magnetic field connecting the parent flare/source to the source surface (Klein et al. 2008);
-
a large-scale meandering field lines, which can lead to the mixing of empty magnetic flux tubes and those filled with energetic particles due to some flux tubes being connected to the source region and others not. This can result in very small local cross-field diffusion as observed for instance during so-called "dropout" events (e.g., Mazur et al. 2000; Giacalone & Jokipii 2012; Laitinen et al. 2013) and may form a finger intensity distribution;
-
strongly differing IP propagation conditions (e.g., Marsch 2006; Ragot 2006) along the different paths to each s/c, which may essentially affect the electron mean free path, the anisotropy, the intensity and consequently the onset time at 1 AU;
-
a global asymmetric CME/shock, which determines the SEP injection and the intensity distribution at different longitudes (Lario et al. 2016);
-
multi-point injections into different coronal magnetic structures below the source surface, as suggested by Wang et al. (2014) and Klassen et al. (2015).
The suggested scenario where the open field lines of the flaring AR provide prompt access to the IP medium forms the fingers and where the CH and its associated high-speed stream forms the valleys seems to be more favorable in relation to the presented SEP events. Indeed, during the three events on 25 February 2014 and on 1 August 2014 – when the STB footpoints were situated inside or on the outskirts of CHs and when the s/c itself was inside the CIRs (Figs. 5 and 10a) – it measured less intense and less impulsive time profiles, and delayed onsets with respect to the STA situated outside the high-speed stream. The magnetic connection to the CH is confirmed by the observation of high-speed solar wind streams measured at STB at that time (Figs. 9 and 13). Obviously, different levels of turbulence in slow- and high-speed solar wind streams imply different values of perpendicular transport/diffusion and of the propagation mean free path. Therefore, a higher turbulence and scattering inside the CHs and CIRs may partly shield the penetration of particles, reduce the peak intensity, and delay the particle arrival at the s/c situated inside a high-speed stream. Strong differences in electron intensities were also observed at Ulysses when it was situated in high-speed solar wind CH streams at high heliographic latitudes in comparison to 1 AU measurements in the ecliptic at the ACE s/c (Lario et al. 2003). In this case, a strong intensity reduction inside the CHs and a non-Gaussian SEP distribution at 1 AU contradicts the idea of a strong and fast perpendicular particle spread in the corona and in the IP medium as suggested by Dresing et al. (2012) and Dröge et al. (2014) for widespread SEP events. In addition, we cannot exclude an additional unknown mechanism preventing particle penetration into the CH through its border.
For the SEP event on 11 October 2013 the situation is less obvious and a combination of scenarios 2, 3, 5 may be responsible for the observed timing and intensity distribution because both STEREO s/c were situated inside a slow solar wind during relatively quiet and similar IP conditions. Therefore a non-radial electron injection pattern could play an important role in building up the unexpected intensity distribution. Such non-radial electron injection is often observed by tracing of type III radio bursts showing non-radial trajectories and positions relative to the parent flare (e.g., Klassen et al. 1999, 2012). The same is valid for type II radio bursts and coronal shocks, which sometimes show a non-radial/azimuthal propagation trajectory in the corona (Aurass et al. 1998).
The observed unexpected angular intensity distribution at 1 AU and proposed finger distribution can be also interpreted as a two-component particle distribution (Klassen et al. 2005; Kocharov et al. 2015). The first one is a prompt component (fingers) implying a relatively narrow injection pattern because of direct particle injection along the open field lines. The second one (Gaussian-like) implies a prolonged-in-time and broad-in-space component, which may originate from trapped particles undergoing cross-field diffusion in the corona and IP medium. Such a trapped population of relativistic electrons was already observed during so-called radio-CMEs (Bastian et al. 2001). These electrons could be trapped for a longer time and escape into IP space owing different processes (e.g., local reconnections, diffusion, etc.) and may explain the broadness of the SEP distribution around the Sun for widespread SEP events and a relative small difference in electron intensities measured at STEREO and at SOHO, although their angular separation to the source was relatively large (70° and 125°) as in the SEP event on 25 February 2014. Alternatively, a shock propagating towards the s/c which continues to accelerate particles could also be the reason for a broad Gaussian-like distribution as suggested by Lario et al. (2016).
5. Summary
We presented a study of four solar electron events observed by the two closely spaced STEREO s/c during the approach to the superior solar conjunction between October 2013 and August 2014, and by SOHO at L1. During this period the longitudinal separation between STA and STB was relatively small, between 72° and 34°.
All presented events show an unexpected peak intensity distribution, and an unexpected SEP onset timing between the two STEREO s/c and also with respect to the associated type III radio bursts. The strong difference in peak intensities (a factor of ≤12) and the delayed particle onset at the s/c nominally closest connected to the flare in comparison to the farther one led us to suggest a concept of rippled peak intensity distribution (i.e., quasi uniform Gaussian plus fingers) at 1 AU.
The fingers could be formed by the open field lines connecting the parent source to the s/c through the source surface allowing a fast particle transport from the source to the s/c. The valleys between the fingers could be formed by CHs and their associated high-speed streams, shielding partially the penetration of particles inside of it and preventing a prompt particle propagation. This effect could delay the particle arrival times at 1 AU and reduce the observed intensities. This concept in combination with non-radial particle injection along the non-radial magnetic field distribution below the source surface may explain the unusual particle distributions and onset timing in the presented SEP events.
Acknowledgments
We thank the STEREO SWAVES, IMPACT, SECCHI, PLASTIC, MAG and GONG teams for providing the data used in this paper and the FESTIVAL team who developed the browser for solar imaging data. The authors thank the anonymous referee for valuable comments. R. Gómez-Herrero acknowledges the financial support by the Spanish Ministerio de Economía y Competitividad under project ESP2013-48346-C2-1-R and the University of Alcalá under project CCG2015/EXP-055. The STEREO/SEPT and SOHO/EPHIN projects are supported under grant 50 OC 1302 by the German Bundesministerium für Wirtschaft through the Deutsches Zentrum für Luft- und Raumfahrt (DLR).
References
- Acuña, M. H., Curtis, D., Scheifele, J. L., et al. 2008, Space Sci. Rev., 136, 203 [NASA ADS] [CrossRef] [Google Scholar]
- Aurass, H., Hofmann, A., & Urbarz, H.-W. 1998, A&A, 334, 289 [NASA ADS] [Google Scholar]
- Bastian, T. S., Pick, M., Kerdraon, A., Maia, D., & Vourlidas, A. 2001, ApJ, 558, L65 [NASA ADS] [CrossRef] [Google Scholar]
- Bougeret, J. L., Goetz, K., Kaiser, M. L., et al. 2008, Space Sci. Rev., 136, 487 [NASA ADS] [CrossRef] [Google Scholar]
- Cane, H. V. 1996, in AIP Conf. Proc., 374, 124 [Google Scholar]
- Cane, H. V. 2003, ApJ, 598, 1403 [NASA ADS] [CrossRef] [Google Scholar]
- Crooker, N. U., Gosling, J. T., Bothmer, V., et al. 1999, Space Sci. Rev., 89, 179 [NASA ADS] [CrossRef] [Google Scholar]
- Dresing, N., Gómez-Herrero, R., Klassen, A., et al. 2012, Sol. Phys., 281, 281 [NASA ADS] [Google Scholar]
- Dresing, N., Gómez-Herrero, R., Heber, B., et al. 2014, A&A, 567, A27 [NASA ADS] [CrossRef] [EDP Sciences] [Google Scholar]
- Dröge, W., Kartavykh, Y. Y., Klecker, B., & Kovaltsov, G. A. 2010, ApJ, 709, 912 [NASA ADS] [CrossRef] [Google Scholar]
- Dröge, W., Kartavykh, Y. Y., Dresing, N., Heber, B., & Klassen, A. 2014, J. Geophys. Res. (Space Phys.), 119, 6074 [Google Scholar]
- Galvin, A. B., Kistler, L. M., Popecki, M. A., et al. 2008, Space Sci. Rev., 136, 437 [NASA ADS] [CrossRef] [Google Scholar]
- Giacalone, J. & Jokipii, J. R. 2012, ApJ, 751, L33 [NASA ADS] [CrossRef] [Google Scholar]
- Gómez-Herrero, R., Dresing, N., Klassen, A., et al. 2015, ApJ, 799, 55 [NASA ADS] [CrossRef] [Google Scholar]
- Haggerty, D. K., & Roelof, E. C. 2002, ApJ, 579, 841 [NASA ADS] [CrossRef] [Google Scholar]
- Howard, R. A., Moses, J. D., Vourlidas, A., et al. 2008, Space Sci. Rev., 136, 67 [NASA ADS] [CrossRef] [Google Scholar]
- Huttunen-Heikinmaa, K., Valtonen, E., & Laitinen, T. 2005, A&A, 442, 673 [NASA ADS] [CrossRef] [EDP Sciences] [Google Scholar]
- Kahler, S. W., Aurass, H., Mann, G., & Klassen, A. 2007, ApJ, 656, 567 [NASA ADS] [CrossRef] [Google Scholar]
- Kahler, S. W., Haggerty, D. K., & Richardson, I. G. 2011, ApJ, 736, 106 [NASA ADS] [CrossRef] [Google Scholar]
- Kallenrode, M.-B. 1993, J. Geophys. Res., 98, 5573 [NASA ADS] [CrossRef] [Google Scholar]
- Klassen, A., Aurass, H., Klein, K.-L., Hofmann, A., & Mann, G. 1999, A&A, 343, 287 [NASA ADS] [Google Scholar]
- Klassen, A., Bothmer, V., Mann, G., et al. 2002, A&A, 385, 1078 [NASA ADS] [CrossRef] [EDP Sciences] [Google Scholar]
- Klassen, A., Krucker, S., Kunow, H., et al. 2005, J. Geophys. Res. (Space Phys.), 110, A09S04 [Google Scholar]
- Klassen, A., Gómez-Herrero, R., Heber, B., et al. 2012, A&A, 542, A28 [NASA ADS] [CrossRef] [EDP Sciences] [Google Scholar]
- Klassen, A., Dresing, N., Gómez-Herrero, R., & Heber, B. 2015, A&A, 580, A115 [NASA ADS] [CrossRef] [EDP Sciences] [Google Scholar]
- Klein, K.-L., Krucker, S., Lointier, G., & Kerdraon, A. 2008, A&A, 486, 589 [NASA ADS] [CrossRef] [EDP Sciences] [Google Scholar]
- Kocharov, L., Klassen, A., Valtonen, E., Usoskin, I., & Ryan, J. M. 2015, ApJ, 811, L9 [NASA ADS] [CrossRef] [Google Scholar]
- Krucker, S., Larson, D. E., Lin, R. P., & Thompson, B. J. 1999, ApJ, 519, 864 [NASA ADS] [CrossRef] [Google Scholar]
- Laitinen, T., Dalla, S., & Marsh, M. S. 2013, ApJ, 773, L29 [NASA ADS] [CrossRef] [Google Scholar]
- Lario, D., Roelof, E. C., Decker, R. B., & Reisenfeld, D. B. 2003, Adv. Space Res., 32, 579 [NASA ADS] [CrossRef] [Google Scholar]
- Lario, D., Aran, A., Gómez-Herrero, R., et al. 2013, ApJ, 767, 41 [NASA ADS] [CrossRef] [Google Scholar]
- Lario, D., Raouafi, N. E., Kwon, R.-Y., et al. 2014, ApJ, 797, 8 [Google Scholar]
- Lario, D., Kwon, R.-Y., Vourlidas, A., et al. 2016, ApJ, 819, 72 [NASA ADS] [CrossRef] [Google Scholar]
- Marsch, E. 2006, Liv. Rev. Sol. Phys., 3, 1 [Google Scholar]
- Mazur, J. E., Mason, G. M., Dwyer, J. R., et al. 2000, ApJ, 532, L79 [Google Scholar]
- Müller-Mellin, R., Kunow, H., Fleissner, V., et al. 1995, Sol. Phys., 162, 483 [Google Scholar]
- Müller-Mellin, R., Böttcher, S., Falenski, J., et al. 2008, Space Sci. Rev., 136, 363 [NASA ADS] [CrossRef] [Google Scholar]
- Ragot, B. R. 2006, ApJ, 653, 1493 [NASA ADS] [CrossRef] [Google Scholar]
- Richardson, I. G., von Rosenvinge, T. T., Cane, H. V., et al. 2014, Sol. Phys., 289, 3059 [Google Scholar]
- Strauss, R. D., & Fichtner, H. 2015, ApJ, 801, 29 [Google Scholar]
- von Rosenvinge, T. T., Reames, D. V., Baker, R., et al. 2008, Space Sci. Rev., 136, 391 [NASA ADS] [CrossRef] [Google Scholar]
- Wang, L., Lin, R. P., Krucker, S., & Gosling, J. T. 2006, Geophys. Res. Lett., 33, 3106 [NASA ADS] [CrossRef] [Google Scholar]
- Wang, Y., Qin, G., Zhang, M., & Dalla, S. 2014, ApJ, 789, 157 [NASA ADS] [CrossRef] [Google Scholar]
- Wibberenz, G., & Cane, H. V. 2006, ApJ, 650, 1199 [NASA ADS] [CrossRef] [Google Scholar]
- Wiedenbeck, M. E., Mason, G. M., Cohen, C. M. S., et al. 2013, ApJ, 762, 54 [NASA ADS] [CrossRef] [Google Scholar]
Appendix A: Additional table
Event properties.
All Tables
All Figures
|
Fig. 1 STEREO-B EUVI 195 Å difference images showing the flare location and the evolution of the circular EIT-wave relative to the nominal magnetic footpoints of STA (red) and STB (blue) during the SEP event on 11 October 2013. Top right: longitudinal positions of STA, STB, and Earth/SOHO and the nominal Parker spirals connecting them to the Sun. The arrow indicates the location of the parent flare, the source of the SEP event. The angular separations between the s/c magnetic footpoints and the flare position are inserted in the upper right corner. |
| In the text | |
|
Fig. 2 Electron event on 11 October 2013. Top: intensity time profiles detected at STA (red) and STB (blue) showing distinct differences in peak intensities and in the onset times. For comparison the intensity profile at SOHO is shown in green. Bottom: enlarged time profiles and intensity pitch-angle distributions measured by STA and STB (shaded interval on the top). |
| In the text | |
|
Fig. 3 Synoptic magnetic field map from GONG1 showing the PFSS1 open magnetic field lines connecting to the ecliptic plane on 11 October 2013. S/c magnetic nominal footpoints are indicated by circles. STA is shown in red, SOHO in green, STB in blue. The location of the associated flaring AR is indicated by a gold diamond. |
| In the text | |
|
Fig. 4 Event on 11 October 2013. Solar wind and magnetic field measurements from 10 to 17 October 2013 (red: STA, blue: STB). From top to bottom: solar wind proton speed, proton density, proton temperature, magnetic field magnitude, magnetic field latitudinal, and longitudinal angles. The vertical solid line marks the SEP onset and the dashed lines mark IP shocks observed at STB. |
| In the text | |
|
Fig. 5 STEREO-B EUVI 195 Å direct (left) and difference images (right) showing the flare location, the dome-shaped EIT-wave, and the coronal hole (CH) in relation to the nominal magnetic footpoints of STA (red) and STB (blue) during the SEP event on 25 February 2014. |
| In the text | |
|
Fig. 6 Longitudinal positions of STA, STB, and Earth/SOHO and the nominal Parker spirals connecting them to the Sun. The black arrow indicates the location of the parent flare, the source of the SEP event on 25 February 2014. The angular separations between the s/c magnetic footpoints and the flare position are inserted in the upper right corner. |
| In the text | |
|
Fig. 7 Event on 25 February 2014. Top: electron time profiles detected at STA (red), STB (blue), and SOHO (green). STA shows an earlier onset and higher intensities at the beginning of the event than STB. The spike before the event onset in EPHIN data is due to the hard X-ray contamination. Bottom: enlarged interval (shaded period on the top) of time profiles at STA and STB. The PAD measured by STA shows a clear anisotropy from the event onset until 02:00 UT. PAD data for STB are not available because of a data gap in MAG data. |
| In the text | |
|
Fig. 8 Synoptic magnetic field map from GONG for the event on 25 February 2014. Description as in Fig. 3. |
| In the text | |
|
Fig. 9 Event on 25 February 2014. Solar wind and magnetic field data as in Fig. 4. SEP onset and IP shocks are indicated by solid and dashed vertical lines, respectively. Magnetic field data from 20 to 26 February and solar wind data from 25 to 27 February were not available. |
| In the text | |
|
Fig. 10 Events on 1 August 2014. Electron intensity time profiles detected at STA (red) and STB (blue). During both events STA shows an earlier onset, higher intensity, and stronger anisotropy than STB. |
| In the text | |
|
Fig. 11 a) STEREO-B EUVI 195 Å image showing the jet/flare location in relation to the nominal magnetic footpoints of STA (red) and STB (blue) and the CH associated with the SEP events on 1 August 2014. b) The same as in Fig. 1. |
| In the text | |
|
Fig. 12 Synoptic magnetic field map from GONG for events on 1 August 2014. Description as in Fig. 3. |
| In the text | |
|
Fig. 13 Events on 1 August 2014. Solar wind and magnetic field data. SEP onset and CIRs are indicated by solid and dashed vertical lines, respectively. |
| In the text | |
|
Fig. 14 a) Onset time delays of 55–65 keV electrons relative to the type III radio burst onset vs. angular separation between the parent flare and s/c footpoints as observed by STA (Λ) and STB (◯). b) Angular distribution of peak electron intensities normalized to the smallest peak. The pre-event background is subtracted. The letter (F) indicates the s/c that detected the event onset first. The difference in radial distance to the Sun for each s/c is not taken into account; therefore, the values for STB could be 10−20% higher. We note that the first two events (red and blue) are widespread and the third one (green) is a spike event. |
| In the text | |
|
Fig. 15 Angular distribution and Gaussian fits to the peak intensities of 0.7–2.8 MeV electrons measured at HET/STA (■) and HET/STB (•), and 0.7–3.0 MeV electrons at EPHIN/SOHO (▴) for the events on 11 October 2013 (a) and 25 February 2014 (b). Negative separation angles denote the s/c magnetic footpoint to the east from the flare. The pre-event background has been subtracted. |
| In the text | |
|
Fig. 16 Proposed spatial peak intensity distribution of SEP events at 1 AU vs. angular separation of the s/c with respect to the flare. |
| In the text | |
Current usage metrics show cumulative count of Article Views (full-text article views including HTML views, PDF and ePub downloads, according to the available data) and Abstracts Views on Vision4Press platform.
Data correspond to usage on the plateform after 2015. The current usage metrics is available 48-96 hours after online publication and is updated daily on week days.
Initial download of the metrics may take a while.