Free Access
Fig. 11
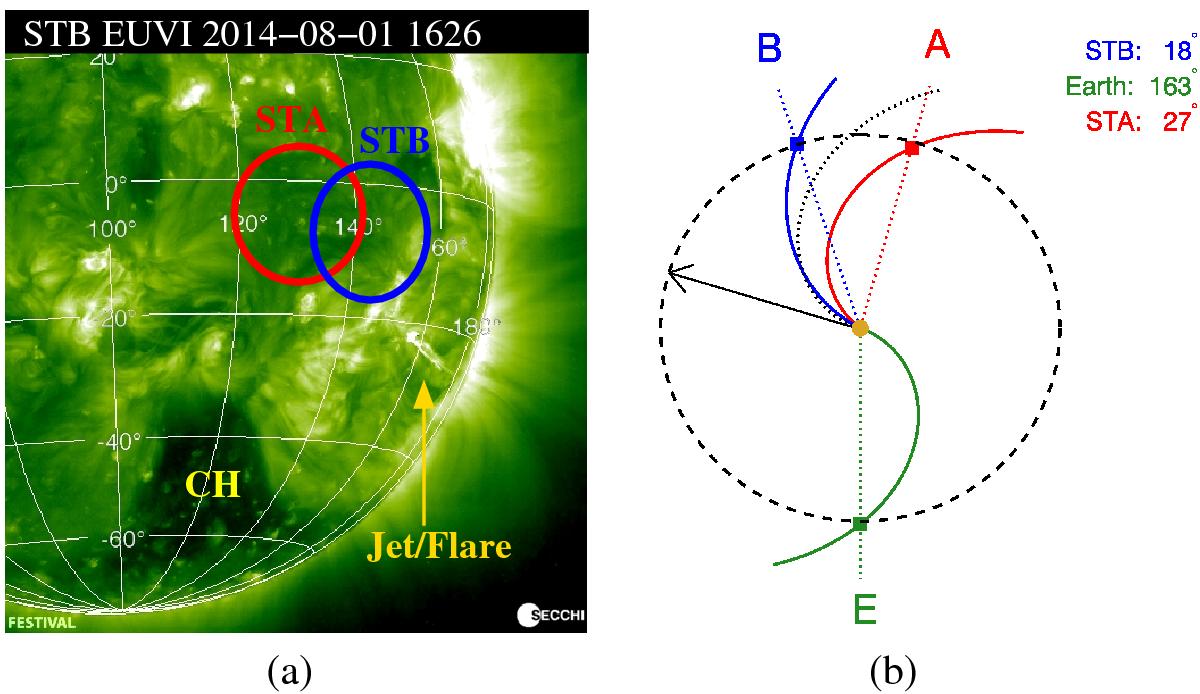
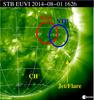
a) STEREO-B EUVI 195 Å image showing the jet/flare location in relation to the nominal magnetic footpoints of STA (red) and STB (blue) and the CH associated with the SEP events on 1 August 2014. b) The same as in Fig. 1.
This figure is made of several images, please see below:
Current usage metrics show cumulative count of Article Views (full-text article views including HTML views, PDF and ePub downloads, according to the available data) and Abstracts Views on Vision4Press platform.
Data correspond to usage on the plateform after 2015. The current usage metrics is available 48-96 hours after online publication and is updated daily on week days.
Initial download of the metrics may take a while.