Fig. 1
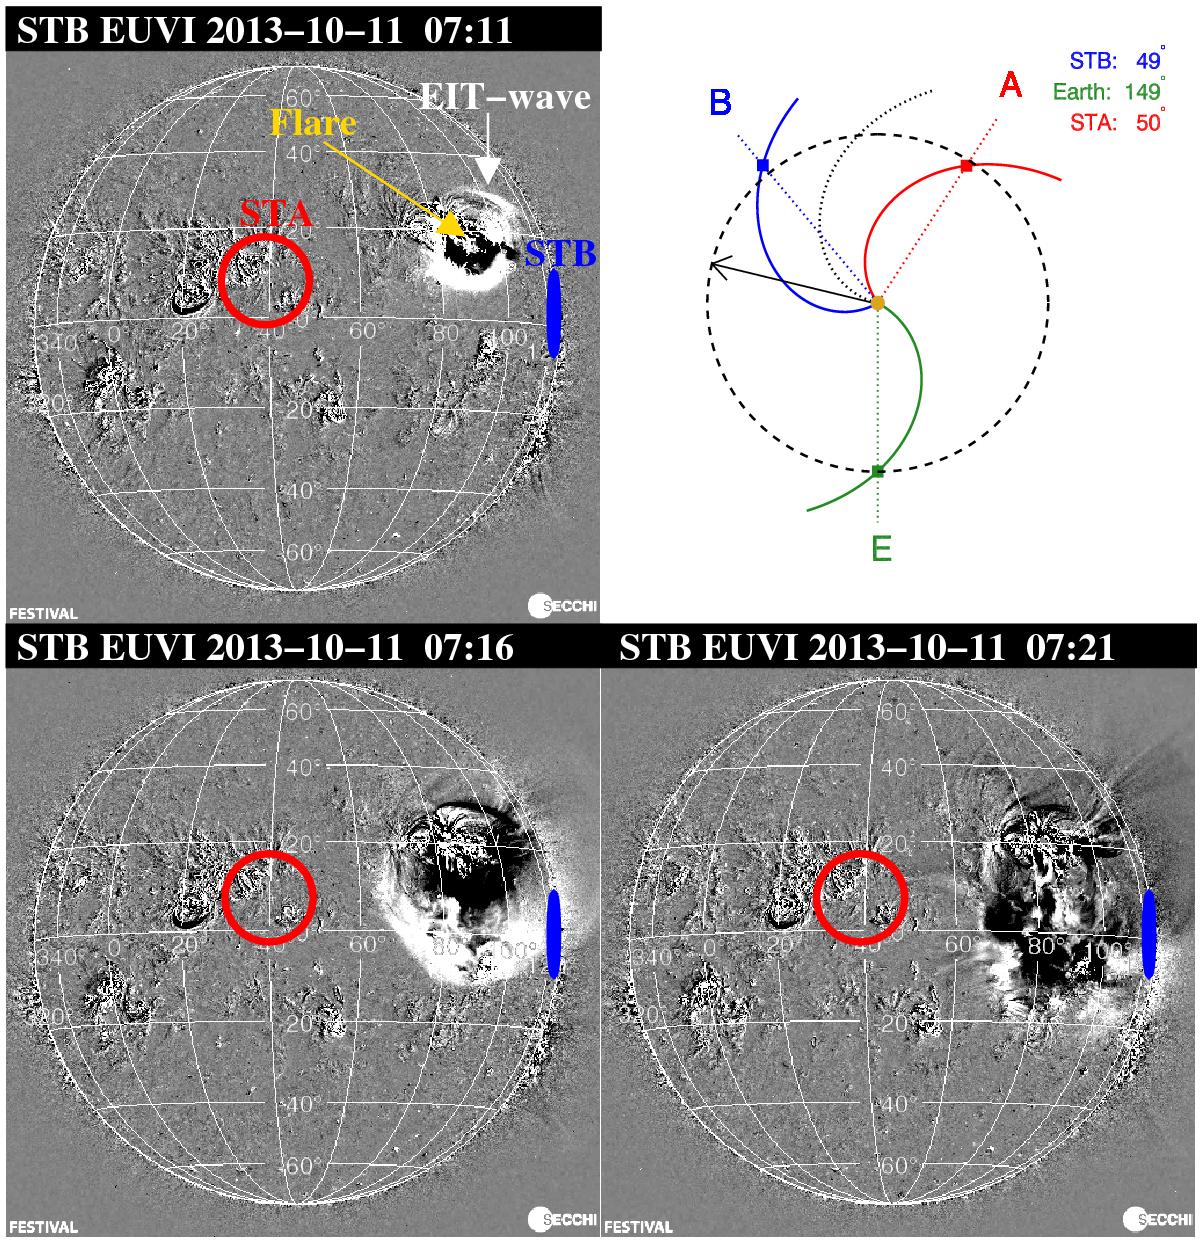
STEREO-B EUVI 195 Å difference images showing the flare location and the evolution of the circular EIT-wave relative to the nominal magnetic footpoints of STA (red) and STB (blue) during the SEP event on 11 October 2013. Top right: longitudinal positions of STA, STB, and Earth/SOHO and the nominal Parker spirals connecting them to the Sun. The arrow indicates the location of the parent flare, the source of the SEP event. The angular separations between the s/c magnetic footpoints and the flare position are inserted in the upper right corner.
Current usage metrics show cumulative count of Article Views (full-text article views including HTML views, PDF and ePub downloads, according to the available data) and Abstracts Views on Vision4Press platform.
Data correspond to usage on the plateform after 2015. The current usage metrics is available 48-96 hours after online publication and is updated daily on week days.
Initial download of the metrics may take a while.