Fig. 7
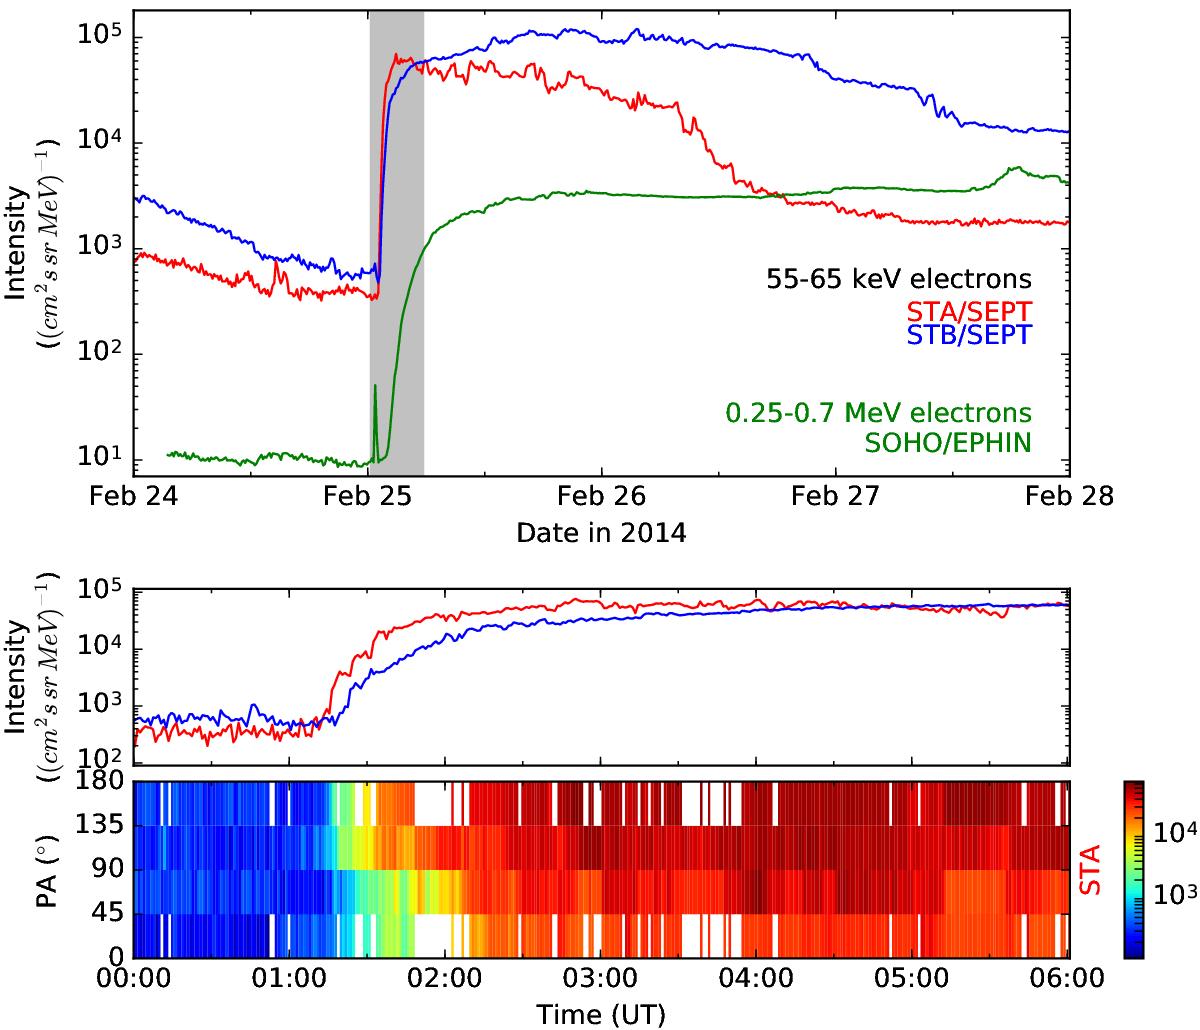
Event on 25 February 2014. Top: electron time profiles detected at STA (red), STB (blue), and SOHO (green). STA shows an earlier onset and higher intensities at the beginning of the event than STB. The spike before the event onset in EPHIN data is due to the hard X-ray contamination. Bottom: enlarged interval (shaded period on the top) of time profiles at STA and STB. The PAD measured by STA shows a clear anisotropy from the event onset until 02:00 UT. PAD data for STB are not available because of a data gap in MAG data.
Current usage metrics show cumulative count of Article Views (full-text article views including HTML views, PDF and ePub downloads, according to the available data) and Abstracts Views on Vision4Press platform.
Data correspond to usage on the plateform after 2015. The current usage metrics is available 48-96 hours after online publication and is updated daily on week days.
Initial download of the metrics may take a while.