Free Access
Fig. 10
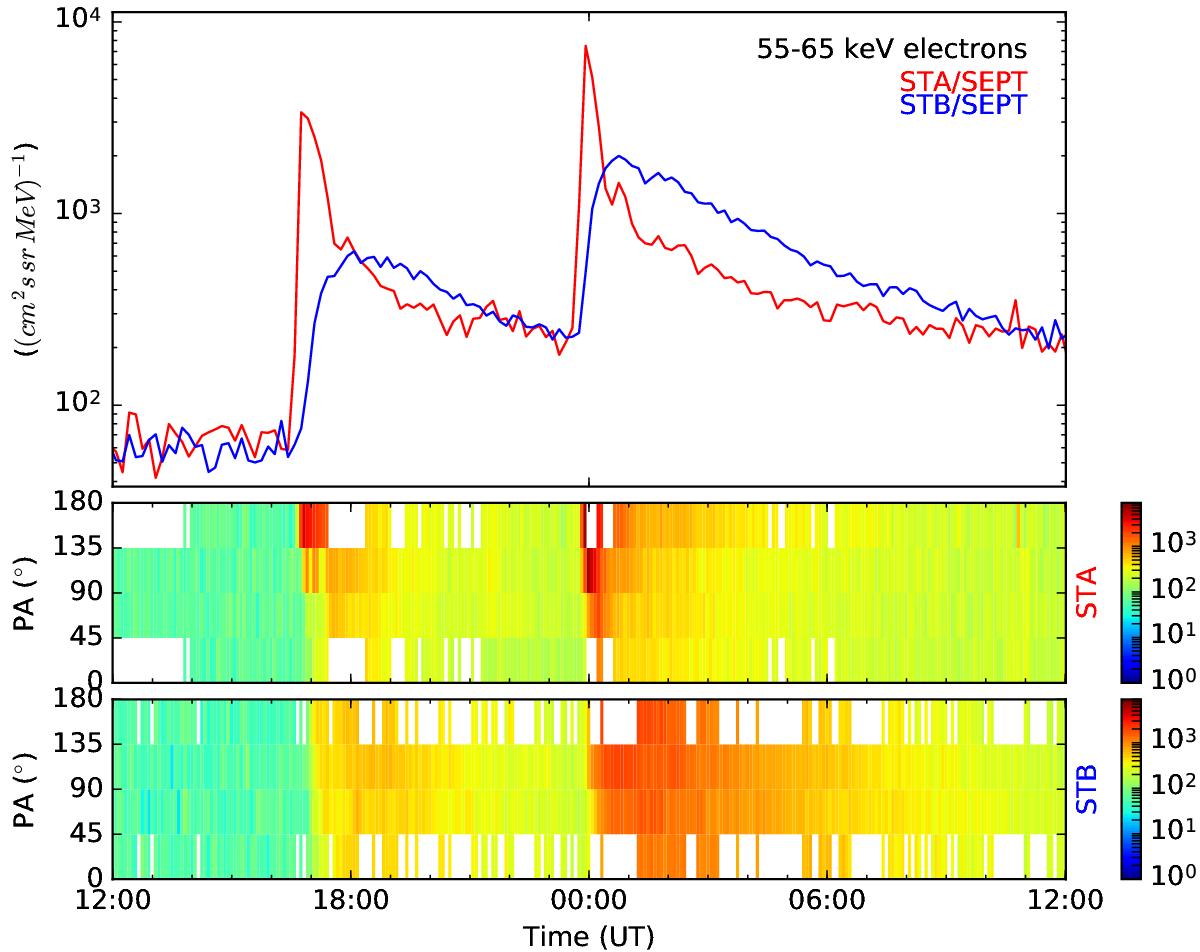
Events on 1 August 2014. Electron intensity time profiles detected at STA (red) and STB (blue). During both events STA shows an earlier onset, higher intensity, and stronger anisotropy than STB.
Current usage metrics show cumulative count of Article Views (full-text article views including HTML views, PDF and ePub downloads, according to the available data) and Abstracts Views on Vision4Press platform.
Data correspond to usage on the plateform after 2015. The current usage metrics is available 48-96 hours after online publication and is updated daily on week days.
Initial download of the metrics may take a while.