Fig. 2
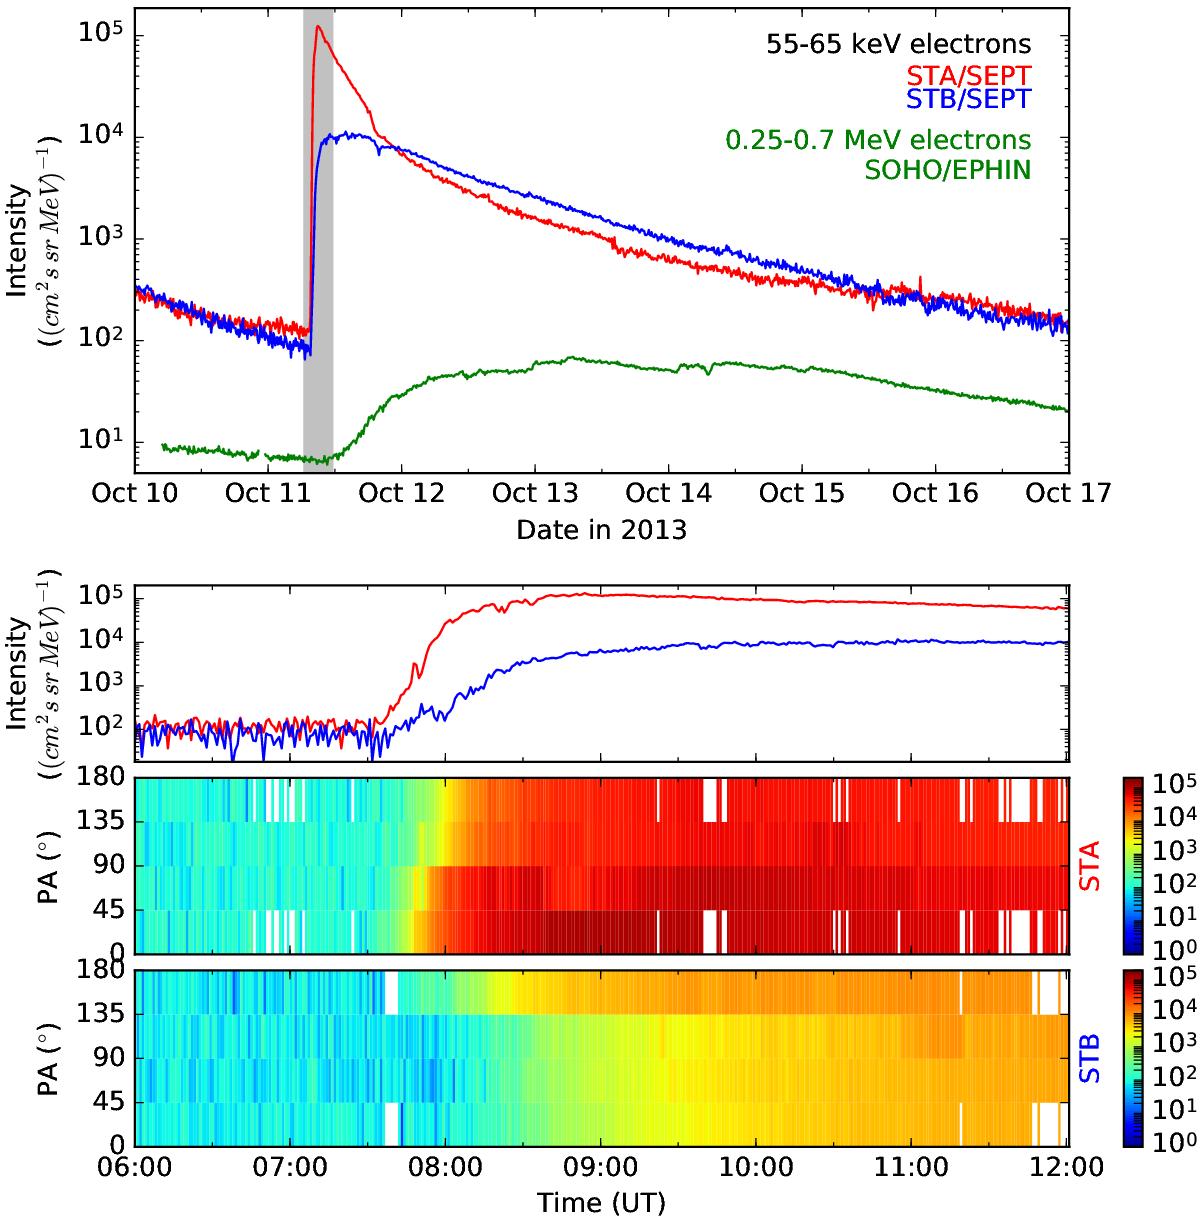
Electron event on 11 October 2013. Top: intensity time profiles detected at STA (red) and STB (blue) showing distinct differences in peak intensities and in the onset times. For comparison the intensity profile at SOHO is shown in green. Bottom: enlarged time profiles and intensity pitch-angle distributions measured by STA and STB (shaded interval on the top).
Current usage metrics show cumulative count of Article Views (full-text article views including HTML views, PDF and ePub downloads, according to the available data) and Abstracts Views on Vision4Press platform.
Data correspond to usage on the plateform after 2015. The current usage metrics is available 48-96 hours after online publication and is updated daily on week days.
Initial download of the metrics may take a while.