Fig. 4
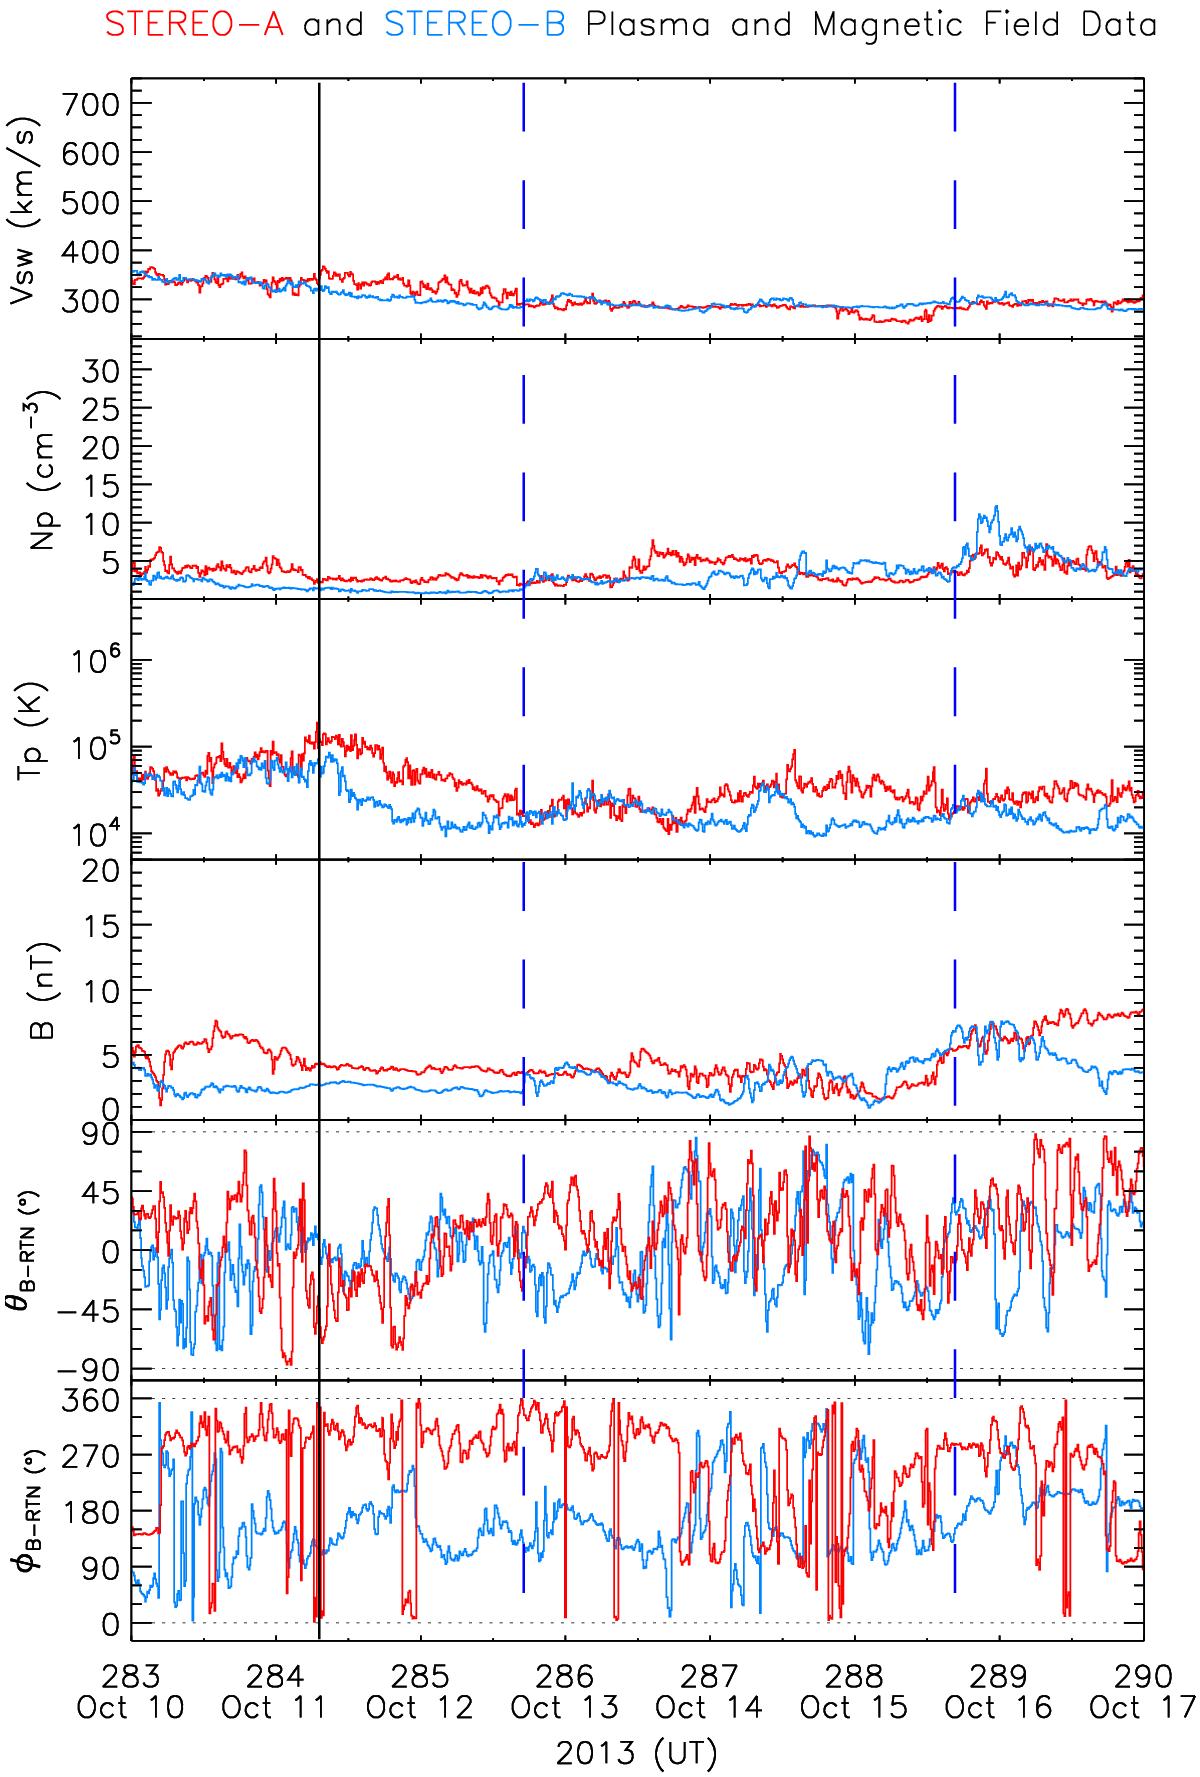
Event on 11 October 2013. Solar wind and magnetic field measurements from 10 to 17 October 2013 (red: STA, blue: STB). From top to bottom: solar wind proton speed, proton density, proton temperature, magnetic field magnitude, magnetic field latitudinal, and longitudinal angles. The vertical solid line marks the SEP onset and the dashed lines mark IP shocks observed at STB.
Current usage metrics show cumulative count of Article Views (full-text article views including HTML views, PDF and ePub downloads, according to the available data) and Abstracts Views on Vision4Press platform.
Data correspond to usage on the plateform after 2015. The current usage metrics is available 48-96 hours after online publication and is updated daily on week days.
Initial download of the metrics may take a while.