| Issue |
A&A
Volume 592, August 2016
|
|
|---|---|---|
| Article Number | A80 | |
| Number of page(s) | 9 | |
| Section | Planets and planetary systems | |
| DOI | https://doi.org/10.1051/0004-6361/201628662 | |
| Published online | 01 August 2016 | |
Near-infrared photometry of WISE J085510.74–071442.5
1 Centro de Astrobiología (CSIC-INTA), Carretera de Ajalvir km 4, 28850 Torrejón de Ardoz, Madrid, Spain
e-mail: This email address is being protected from spambots. You need JavaScript enabled to view it.
2 Instituto de Astrofísica de Canarias, C/. Vía Láctea s/n, 38205 La Laguna, Tenerife, Spain
3 Departamento de Astrofísica, Universidad de La Laguna, 38206 La Laguna, Tenerife, Spain
4 European Southern Observatory, Alonso de Córdova 3107, Vitacura, Santiago, Chile
5 Instituto de Física y Astronomía, Facultad de Ciencias, Univ. de Valparaíso, Av. Gran Bretaña 1111, Valparaíso, Chile
6 Núcleo de Astronomía, Facultad de Ingeniería, Univ. Diego Portales, Av. Ejercito 441, Santiago, Chile
7 Dpt. Ciencias Físicas, Univ. Andrés Bello, Campus La Casona, Fernández Concha 700, Santiago, Chile
8 The Millennium Institute of Astrophysics, Santiago, Chile
9 Vatican Observatory, 00120 Vatican City State, Italy
Received: 7 April 2016
Accepted: 26 May 2016
Abstract
Aims. We aim at obtaining near-infrared photometry and deriving the mass, age, temperature, and surface gravity of WISE J085510.74–071442.5 (J0855–0714), which is the coolest object beyond the solar system currently known.
Methods. We used publicly available data from the archives of the Hubble Space Telescope (HST) and the Very Large Telescope (VLT) to determine the emission of this source at 1.153 μm (F110W) and 1.575 μm (CH4-off). J0855–0714 was detected at both wavelengths with a signal-to-noise ratio of ≈10 (F110W) and ≈4 (CH4-off) at the peak of the corresponding point-spread-functions.
Results. This is the first detection of J0855–0714 in the H-band wavelengths. We measured 26.31 ± 0.10 and 23.22 ± 0.35 mag in F110W and CH4-off (Vega system). J0855–0714 remains unresolved in the HST images that have a spatial resolution of 0.22′′. Companions at separations of 0.5 AU (similar mass and brightness) and at ~1 AU (≈1 mag fainter in the F110W filter) are discarded. By combining the new data with published photometry, including non-detections, we build the spectral energy distribution of J0855–0714 from 0.89 through 22.09 μm, and contrast it against current solar-metallicity models of planetary atmospheres. We determine that the best spectral fit yields a temperature of 225–250 K, a bolometric luminosity of log L/L⊙ = −8.57, and a high surface gravity of log g = 5.0 (cm s-2), which suggests an old age although a gravity this high is not fully compatible with evolutionary models. After comparing our data with the cooling theory for brown dwarfs and planets, we infer a mass in the interval 2–10 MJup for ages of 1–12 Gyr and high atmospheric gravities of log g ⪆ 3.5 (cm s-2). If it had the age of the Sun, J0855–0714 would be a ≈5-MJup free-floating planetary-mass object.
Conclusions. J0855–0714 meets the mass values previously determined for free-floating planetary-mass objects discovered in star-forming regions and young stellar clusters. Based on extrapolations of the substellar mass functions of young clusters to the field, as many J0855–0714-like objects as M5–L2 stars may be expected to populate the solar neighborhood.
Key words: brown dwarfs / stars: late-type / stars: low-mass / planetary systems
© ESO, 2016
1. Introduction
Free-floating, planetary-mass objects with masses near and below the deuterium-burning limit at 13 Jupiter masses (MJup) and temperatures below ~2200 K are established in several star-forming regions and open clusters younger than ~150 Myr, including Orion (Lucas & Roche 2000; Lucas et al. 2001; Zapatero Osorio et al. 2000; Barrado y Navascués et al. 2001; Weights et al. 2009; Bayo et al. 2011), ρ Ophiucus (Marsh et al. 2010), Upper Scorpius (Lodieu et al. 2013), Chamaeleon-I (Mužić et al. 2015, and references therein), and the Pleiades (Zapatero Osorio et al. 2014c,a). At the age of a few Gyr, substellar evolutionary models predict extremely low temperatures (typically ≤500 K), similar to the planets of our solar system, for these isolated planetary-mass objects (Chabrier et al. 2000; Burrows et al. 2003). To date, only one unique object of this type is known, WISE J085510.83–071442.5, which was discovered by Luhman (2014, hereafter J0855–0714); it probably represents the cold and old version of the young, free-floating planetary-mass objects.
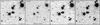 |
Fig. 1 Identification of WISE J085510.74–071442.5 (at the center of the red circles) on the WFC3 and Hawk-I images sized 24′′ × 24′′. The observing dates and filters are indicated. North is up and east is to the left. |
J0855–0714 was found after a careful analysis of multi-epoch astrometry from the Wide-field Infrared Survey Explorer (WISE) and the Spitzer Space Telescope data. It has a high proper motion of 8.13 ± 0.3 arcsec yr-1 and is located at a distance of 2.31 ± 0.08 pc (Luhman & Esplin 2014; Wright et al. 2014), which makes it the fourth closest known system to the Sun. The most striking property of J0855–0714 is its extremely cool nature as inferred from the very red colors [3.6] − [4.5], W1−W2, and J− [4.5] (Faherty et al. 2014). Luhman (2014) estimated a temperature of Teff = 225–260 K, thus confirming J0855–0714 as the coldest substellar object found in isolation with a temperature that fills the gap between transiting exoplanets and the planets of our solar system. Several groups have attempted to detect J0855–0714 at optical and near-infrared wavelengths using ground-based facilities, but with little success. Kopytova et al. (2014), Beamín et al. (2014), and Wright et al. (2014) reported upper limits of 24.8 mag, 24.4 mag, and 22.7 mag in the z-, Y-, and H-bands, respectively, while the K-band upper limit of 18.6 mag comes from the Visible and Infrared Survey Telescope for Astronomy (VISTA, Emerson et al. 2006) Hemisphere Survey (McMahon et al. 2013) using the VISTA Infrared Camera (VIRCAM, Dalton 2006). The only ground-based reported tentative detection is in the J band (J = 25.0 ± 0.5 mag), but only has a modest signal-to-noise ratio of 2.6σ (Faherty et al. 2014). With all these photometric measurements in hand, current models predict temperatures well below ~500 K and masses in the planetary domain for J0855–0714 (see Leggett et al. 2015). As a reference, the temperature of Jupiter’s atmosphere at 1 bar is 165 K.
Here, we report the first clear near-infrared detections of J0855–0714 at 1.153 and 1.575 μm using public archival data from the European Southern Observatory (ESO) and the Hubble Space Telescope (HST). We employed these data together with published photometry to improve the derivation of the spectral energy distribution and constrain the properties of this intriguing planetary-mass object. The same data are also presented in Luhman & Esplin (2016), where these authors discuss the new near-infrared photometry of J0855–0714 in comparison with other Y dwarfs and model atmospheres.
2. Observations
J0855–0714 was observed with the F110W filter (centered on 1.1534 μm, passband of 0.5 μm) and the Wide-Field Camera 3 (WFC3) onboard the HST on three different occasions (2014 Nov. 25, 2015 Mar. 03, and 2015 Apr. 11) under program number 13802 (PI: K. Luhman). We downloaded the reduced WFC3 frames from the Mikulski Archive for Space Telescopes1, which include flux-calibrated, geometrically corrected, and dither-combined images processed with the CALWF3 code version 3.3. The total exposure time was 5417.6 s per observing epoch. The released images have a plate scale of 0.1285′′ pixel-1 and a spatial resolution of 0.22′′ as measured from the full-width at half-maximum (FWHM). The three public epochs are separated by 98 d (first and second) and 38.3 d (second and third) and have a field of view of approximately 2′× 2′. Because of its high motion and significant parallax, J0855–0714 displaced itself by ~20 and ~10 WFC3 pixels between the first and second and the second and third HST images, respectively. J0855–0714 is detected in the broadband F110W filter on the three occasions with a signal-to-noise ratio of about 10 at the peak flux. Figure 1 shows a portion of the WFC3 images in which our target is identified. Using the phot package within IRAF2, we obtained the F110W photometry for an aperture of 6 pixels (or 0.8′′), a sky annulus between 8 and 15 pixels, and a zero-point of 26.0628 mag (as of the instrument calibration3 of 2012 Mar 06, Vega photometric system). The photometry of the third HST epoch was obtained with a small aperture radius of 2 WFC3 pixels because J0855–0714 lies very close to another source (see Fig. 1). An aperture correction was later applied to bring the derived instrumental photometry to the apparent value used in this paper. The WFC3 frames are astrometrically calibrated; the coordinates of J0855–0714 were determined from the centroids given by phot. The derived magnitudes and the astrometry of J0855–0714 as a function of observing date are given in Table 1.
New photometry and astrometry of J0855–0714.
J0855–0714 was also observed with the methane filter (CH4-off, centered on 1.575 μm, passband of 0.112 μm) of the High Acuity Wide field K-band Imager (HAWK-I; Pirard et al. 2004; Casali et al. 2006; Kissler-Patig et al. 2008; Siebenmorgen et al. 2011) mounted on the Nasmyth A focus of the European Southern Observatory Very Large Telescope (VLT) unit 4. The on-sky field of view is 56.25 arcmin2 with a cross-shaped gap of 15′′ between the four HAWAII 2RG 2048 × 2048 pixels detectors. The expected location of J0855–0714 is in the northwest detector. The pixel scale is 0.106′′. We downloaded the public raw data obtained on different occasions as part of program 094.C-0048 (PI: K. Luhman) and reduced the data for each date separately using the esorex pipeline (version 3.12). The tasks performed by the HAWK-I pipeline included the creation of a master dark and master twilight flat-field as well as the reduction of the jitter observations up to the final reduction stage, which incorporated the alignement and combination of sky-subtracted individual images. We did not run the recipe that handles the zero-point magnitude because it is not available for the methane filter. Of all publicly available images, only three epochs provided the deepest data, which we used here: 2015 Jan. 16, 18, and 20. The seeing was 0.4′′–0.5′′, and on-source exposure times were 2500 s (Jan. 16) and 5000 s (Jan. 18 and 20). These observing dates are bracketed by the HST dates, which allowed us to predict the position of J0855–0714 with a high accuracy. Our target is detected with a weak signal at the expected location in each individual date. Over the period of four days, J0855–0714 moves by less than one HAWK-I pixel. To improve the quality of the detection without degrading the spatial resolution of the original data, we therefore combined the three images into one, a portion of which is illustrated in Fig. 1. J0855–0714 is unambiguously seen with a signal-to-noise ratio of 4 at the peak flux. This is the first time that J0855–0714 is detected at the H-band wavelengths from the ground. We performed the photometric calibration of the methane images by adopting a null (neutral) H−CH4-off color for three 2MASS stars (Skrutskie et al. 2006) that are not saturated in the field covered by the fourth detector. We then obtained the point-spread-function photometry of J0855–0714 deriving CH4-off = 23.22 ± 0.35 mag (Table 1), where the error bar accounts for the photon noise of the target and the uncertainty of the photometric calibration. The obtained F110W and CH4-off photometry is compatible with the F125W and F160W data recently reported by Schneider et al. (2016a). The HST and VLT observing journal is provided in Table A.1.
3. Variability, astrometry, and search for companions
J0855–0714 does not show evidence of photometric variability with amplitudes larger than ~0.1 mag at F110W. However, we caution that the small difference between the three HST detections may not mean low-amplitude variability. Very low-mass dwarfs are known to be fast rotators at nearly all ages. For example, the ~10-Myr planet 2M1207b (Chauvin et al. 2005) rotates with a period of 10.7  h (Zhou et al. 2016), and the two older brown dwarf components of the Luhman 16AB system (the closest known brown dwarfs, Luhman 2013) rotate with a period of 5.1 ± 0.1 h (the B component) and 4–8 h (A) (Burgasser 2014; Buenzli et al. 2015; Mancini et al. 2015). As a reference, Jupiter has a sidereal rotation period of 9.925 h4. Even faster rotations of ≈2 h have been reported in the literature for several brown dwarfs (e.g., Clarke & Tinney 2002; Williams & Berger 2015). The HST observations of J0855–0714 cover 2.35, 3.72, and 5.17 h on the three observing epochs (Table A.1). If the rotation of our target is of the order of hours, then the F110W data would have averaged the object flux over a significant fraction of the rotational period, which could smooth the variability to a small magnitude difference.
Using the published astrometry of J0855–0714 (Luhman & Esplin 2014) and the new measurements from the WFC3 data (Table 1), we determined a new parallax following the procedure described in Zapatero Osorio et al. (2014b). The values obtained, including nine epochs of observations between 2010.34 and 2015.28, are μα = −8.16 ± 0.05 arcsec yr-1, μδ = + 0.66 ± 0.05 arcsec yr-1, and π = 0.464 ± 0.020 arcsec, which translates into a distance of d = 2.16 ± 0.10 pc. These measurements are consistent within 1σ the quoted uncertainties with those of Luhman & Esplin (2014), thus confirming that the distance to J0855–0714 is solidly established.
The excellent spatial resolution of the WFC3 images allowed us to constrain the multiplicity nature of J0855–0714 at separations ≥0.5 AU (provided the trigonometric distance of 2.2 pc). We investigated the presence of any comoving object within a radius of 50 AU (or ≈22′′). At the shortest separations of 0.5 AU, J0855–0714 appears unresolved; therefore, companions of similar brightness (or mass) are discarded. At distances of ≥1 AU from the central object, no other source shows a high proper motion similar to that of our target; hence, companions with F110W brightness up to ≈1 mag fainter (4σ) than J0855–0714 can also be ruled out. If J0855–0714 has any companion, it would lie on a projected orbit with a semi-major axis of most likely less than 0.5 AU. Very accurate astrometry may reveal disturbances in the coordinates of J0855–0714 that might be due to close companions (other planet-hunter techniques such as radial velocity studies are not applicable to J0855–0714 because of its intrinsically faint luminosity and the lack of stable high-resolution spectrographs operating at mid-infrared wavelengths). From the parallax and proper motion solution, we obtained astrometric residuals (i.e., observed minus computed values) that are typically within 3σ of the quoted astrometric uncertainties. A more precise astrometric study can be carried out by considering the relative phase that is artificially introduced by the location of the different space-based observatories. We did not account for this effect here.
4. Temperature and gravity
We built the photometric spectral energy distribution (SED) of J0855–0714 by converting our photometry and the photometry available in the literature (see Sect. 1) into observed flux densities. We used the Vega flux densities of 1784.9 Jy (Schultz et al. 2005) and 1048.801 Jy (Cohen et al. 1992) at F110W and CH4-off, respectively. For the remaining filters we employed the flux densities given in Reach et al. (2005) for Spitzer, Hewett et al. (2006) for z, Y, J, K, and Jarrett et al. (2011) for WISE. The resulting SED is shown in Fig. 2, where clear detections are plotted with a solid symbol and arrows indicate upper limits on the fluxes imposed by limiting magnitudes quoted in the literature. For completeness, we also included the HST photometry of Schneider et al. (2016a) in Fig. 2. Even non-detections are relevant to studying the SED of J0855–0714. The emission of this object is highest at ~4.5 μm and shows a sharp increase by about three orders of magnitude from the near-infrared wavelengths to the peak of the SED. In the near-infrared, the strongest signal occurs at the CH4-off filter because the narrow width of this passband avoids the part of the H band that is strongly absorbed by methane and only registers frequencies less affected by water vapor and methane absorption. The weakest signal is associated with the F110W broadband filter because, in contrast to CH4-off, this passband covers a wide range of wavelengths that are strongly influenced by intense water vapor, ammonia, and methane absorptions (see below).
To constrain the atmospheric properties of J0855–0714, we compared its SED with current solar-metallicity planetary atmosphere models computed by Morley et al. (2014). These models include the treatment of the water cloud opacity in cold atmospheres, which is found to have an effect on the emerging spectrum (Burrows et al. 2004; Sudarsky et al. 2005, and references therein). The grid of models is available for effective temperatures (Teff) and surface gravities (log g) in the intervals 200–450 K and 3.0–5.0 (cm s-2) with increments of 25–50 K and 0.5 dex, respectively. For all theoretical spectra used here, Morley et al. (2014) adopted fsed = 5 and h = 0.5, where fsed is a parameter that describes the efficiency of sedimentation in the atmospheres and h represents the fractional atmospheric area covered in cloud holes. The models also incorporate the salt and sulfide clouds (Na2S, KCl, ZnS, MnS, Cr) and water-ice clouds. In Fig. A.1, various of these theoretical spectra are shown together with the SED of J0855–0714. The models show that the near-infrared fluxes dramatically decline with decreasing temperature. At the coolest temperature of the computations (200 K), nearly all flux emerges in the mid-infrared.
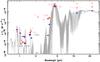 |
Fig. 2 Spectral energy distribution of J0855–0714 (red and black symbols). Circles denote positive detections and arrows indicate upper limits. The black symbols correspond to Schneider et al. (2016a) data. The horizontal error bars account for the width of the various filters. The filters are labeled. The best-fit planetary model atmosphere of Morley et al. (2014) computed as the average of Teff = 225 and 250 K, log g = 5.0 (cm s-2) and 50% cloudy conditions is also shown with a gray line. The blue triangles represent the theoretical flux densities as integrated from the models using the corresponding filter passbands (only for the filters in red). The new detections of J0855–0714 presented here correspond to F110W and CH4. The model is normalized to the emission of J0855–0714 at the wavelengths of the W2 filter. |
To facilitate the comparison between observed and theoretical data, we computed the model photometric SED for each temperature and gravity using the filter passbands corresponding to the various observations of J0855–0714. The resulting theoretical photometric SEDs are also shown normalized to the target W2-band emission in Figs. 2 and A.1. The spectra reported by Morley et al. (2014) describe the SED of J0855–0714 reasonably well. To find the best-fit temperature and gravity, we minimized the following expression: ![Mathematical equation: \begin{equation} \psi^2 = \sum_{i=1}^{n} \frac{[f_{\rm obs}(i)-f_{\rm mod}(i)]^2}{f_{\rm obs}^2(i)} \label{eq1} , \end{equation}](/articles/aa/full_html/2016/08/aa28662-16/aa28662-16-eq50.png) (1)where f stands for the observed and modeled fluxes for each wavelength i in which there is a detection of J0855–0714 (n = 7, F110W, J, CH4-off, W1, [3.6], [4.5], and W2). The best fit (lowest value of ψ2) is found for the theoretical computation with Teff = 225 K and high gravity log g = 5.0 (cm s-2). In the minimization process, the most strongly deviating point corresponds to F110W (see next); models of Teff> 225 K and the F110W observation differ by one and two orders of magnitude. Only the 225-K model provides a good match to this data point (see Fig. A.1). If F110W is removed from Eq. (1), then the best-fit solution is found for a temperature intermediate between 225 and 250 K and log g = 5.0 (cm s-2). A temperature this low agrees with the estimates made for J0855–0714 by Luhman (2014), Wright et al. (2014), Faherty et al. (2014), Beamín et al. (2014), Kopytova et al. (2014), and Leggett et al. (2015). In Fig. 2 we plot an intermediate model spectrum (by averaging the 225-K and 250-K data) along with its computed photometry. The strongest absorption features are due to water, methane, and ammonia, with some tiny contribution from PH3 in the mid-infrared at 4.3 μm.
(1)where f stands for the observed and modeled fluxes for each wavelength i in which there is a detection of J0855–0714 (n = 7, F110W, J, CH4-off, W1, [3.6], [4.5], and W2). The best fit (lowest value of ψ2) is found for the theoretical computation with Teff = 225 K and high gravity log g = 5.0 (cm s-2). In the minimization process, the most strongly deviating point corresponds to F110W (see next); models of Teff> 225 K and the F110W observation differ by one and two orders of magnitude. Only the 225-K model provides a good match to this data point (see Fig. A.1). If F110W is removed from Eq. (1), then the best-fit solution is found for a temperature intermediate between 225 and 250 K and log g = 5.0 (cm s-2). A temperature this low agrees with the estimates made for J0855–0714 by Luhman (2014), Wright et al. (2014), Faherty et al. (2014), Beamín et al. (2014), Kopytova et al. (2014), and Leggett et al. (2015). In Fig. 2 we plot an intermediate model spectrum (by averaging the 225-K and 250-K data) along with its computed photometry. The strongest absorption features are due to water, methane, and ammonia, with some tiny contribution from PH3 in the mid-infrared at 4.3 μm.
Figure 2 shows that the J, CH4-off and [4.5] data of J0855–0714 are reproduced by the model within 1.5σ the quoted uncertainties (all data are normalized to the W2 emission of the target). Additionally, the observed flux upper limits at wavelengths ≥1.4 μm are consistent with the model predictions (this includes H, K, W3, and W4). However, there are discrepancies between the theory and the observations at certain wavelengths. It appears that the models envision a very strong methane absorption at 3–4 μm (see also Fig. A.1), which disagrees with the observations (W1 and [3.6]). At shorter wavelengths, neither F110W nor the bluer filters z and Y are matched by the 225–250 K model. The synthetic spectra warmer than 225 K predict too much emission (or too less absorption) than expected at these wavelengths. F110W includes the non-detection at F105W (Schneider et al. 2016a), and the two detections at F125W- and J bands, the latter of which is reasonably reproduced. This indicates that the models overpredict the flux emission at wavelengths blueward of ~1.1 μm. These mismatches may indicate an incorrect or incomplete treatment of methane in current models. It appears that non-equilibrium carbon chemistry in cool atmospheres, possibly related to vertical flows of material, is required to explain the spectra of L and T dwarfs and the giant planets of the solar system (e.g., Oppenheimer et al. 1998; Visscher & Moses 2011; Currie et al. 2014).
As illustrated in Fig. A.1, the low gravity models envision more flux below ~1 μm than the high-gravity models for a given temperature because of the weaker potassium absorption at low-pressure atmospheres. At the same time, CH4-off becomes fainter at low gravities relative to the J-band fluxes. These two properties (as predicted by the Morley et al. 2014 models) are not compatible with the SED of J0855–0714, for which we find that CH4-off emission is stronger than the J-band fluxes in the units displayed in Fig. 2. This supports the high-gravity nature of J0855–0714.
Figure 3 shows various color–color diagrams in which the location of J0855–0714 is compared with the synthetic indices computed from the spectra of Morley et al. (2014). This figure summarizes part of the discussion above. We note that according to these theoretical spectra, the effect of gravity is great in the low-temperature regime, with notorious differences of about 1–1.5 mag (for a given temperature) in the near-infrared wavelengths. The inversion of the fluxes at J and CH4-off bands between the two gravities considered here is revealed by the blue (negative) and red (positive) J−CH4-off colors displayed in the left panels of Fig. 3. The two bottom panels of the figure, which consider J, CH4-off, [4.5], and W2, are useful to distinguish Teff and gravity for future J0855–0714-like discoveries. Nevertheless, the (large) differences observed between J0855–0714 and the theory in Figs. 2, 3, A.1, and 5 (see below) indicate that some improvements in models of planetary atmosphers and evolution are necessary to better characterize this object.
By integrating the theoretical spectrum normalized to the W2-band of Fig. 2 from 0.6 through 50 μm and for the distance of 2.23 ± 0.10 pc, we determined a bolometric luminosity of log L/L⊙ = −8.57 ± 0.06 dex for J0855–0714, where the uncertainty comes from the errors in W2 and distance. The flux excess below ~1.1 μm given by the model does not have a significant effect on this determination because most of the emission occurs at ~4.5 μm. The luminosity value reported here strongly depends on the models used. The true luminosity of J0855–0714 might be higher if its methane absorption at ~3.5 μm is not as intense as predicted by the model.
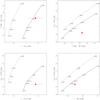 |
Fig. 3 Color–color diagrams of J0855–0714 (red dot) including the synthetic indices (open circles) computed from the Morley et al. (2014) theoretical spectra. The high-gravity colors (log g = 5.0 cm s-2) are joined by a solid line, and the dashed line stands for the low gravity indices (log g = 4.0 cm s-2). All synthetic colors are labeled with their corresponding Teff (K). (CH4 stands for the CH4-off filter.) |
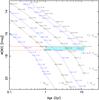 |
Fig. 4 Evolution of the absolute W2 magnitude is shown for masses between 1 and 10 MJup (COND models; Baraffe et al. 2003). Each mass track is labeled with the Teff/log g pair values (K, cm s-2) corresponding to the different ages tabulated in the models. The J0855–0714 absolute W2 magnitude is bracketed by the two horizontal red lines (1σ). The blue shaded area indicates the most likely position of J0855–0714 based on its high surface gravity [log g ⪆ 3.5 (cm s-2)]. |
5. Mass and age
We also compared the observed photometry and the derived Teff and surface gravity with the models for cool brown dwarfs and extrasolar giant planets of Baraffe et al. (2003) to set constraints on the mass and age of J0855–0714. These models directly provide the magnitudes in the filters of interest (except for CH4-off) by integrating over the theoretical spectra computed by Allard et al. (2001). Figure 4 displays the absolute W2 magnitudes as a function of age and planetary mass. We also show the Teff and log g theoretical values of the models in Fig. 4 to aid the discussion below. The flux emission of objects as cool as our target peaks in this band. We relied on W2 to determine the most likely mass and age for J0855–0714. The high gravity obtained in Sect. 4 indicates that this dwarf has a small radius that is compatible with an old age (young objects are undergoing a self-collapse process and have large radii, e.g., Lodieu et al. 2015; Kraus et al. 2015, and references therein). However, the value of log g = 5 (cm s-2) exceeds the gravity predicted by the evolutionary models of Baraffe et al. (2003) for objects as cool as a few hundred K at the age of the Galaxy (~12 Gyr) by at least 0.5 dex. We found the same mismatch when using the evolutionary models of Saumon & Marley (2008). We overcame this discrepancy by qualitatively accepting that J0855–0714 has contracted sufficiently and that it likely has an age typical of the solar neighborhood (Holmberg et al. 2009). The age distribution of the solar vicinity peaks at 1–3 Gyr and rapidly declines toward higher ages (Nordstrom et al. 2004). For these ages, and according to the substellar cooling models shown in Fig. 4, high-gravity values may be defined by log g ⪆ 3.5 (cm s-2) for dwarfs with low planetary-mass.
The absolute W2 magnitude of J0855–0714 and its associated 1σ uncertainty [M(W2) = 17.30 ± 0.17 mag], which includes the errors in the observed photometry and the distance determination, is shown in Fig. 4 with a band marked by two horizontal red lines. Interestingly, and in contrast to the gravity parameter, the Teffs inferred for the target dwarf from the evolutionary model agree with that obtained from the spectral fitting in Sect. 4. We note, however, that for all planetary masses and a given W2 magnitude the models give a similar Teff for any of the ages illustrated in the figure. This degeneracy probably arises because the change in the planets’ radius with age (≥0.1 Gyr) is relatively small (lower than 25%); this means that the size of the planets does not strongly depend on mass. To break this ambiguity, the surface gravity is useful. The blue shaded region depicted in Fig. 4 considers high gravities in the interval log g = 3.6−4.5 (cm s-2), from which we determined the mass of J0855–0714 to be 2–10 MJup for the age interval 1–12 Gyr. J0855–0714 would have a mass of ≈3 MJup at 2 Gyr and a mass of ≈5 MJup at the age of the solar system. Similar results are obtained from the Spitzer [4.5] data.
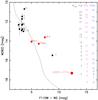 |
Fig. 5 Color-magnitude diagram considering the F110W and W2 filters. Our F110W data are plotted as red symbols (J0855–0714 is labeled). Data from Burgasser et al. (2006) and Luhman et al. (2014) are shown with black circles and labeled with their spectral types. (We assumed that W2 ≈ [4.5] for the Y-dwarf WD0806–661B; Luhman et al. 2012, 2014. This assumption is based on the similarity of these two magnitudes in J0855–0714). The COND 5-Gyr evolutionary model of Baraffe et al. (2003) is depicted with a solid line. Masses in Jovian units predicted for the ages of 1, 5, and 10 Gyr are labeled at the right side. |
Figure 5 illustrates the faint tail of the sequence of ultra-cool dwarfs in the W2 versus F110W−W2 color–magnitude diagram. Data of T0–T7.5 dwarfs from Burgasser et al. (2006) and the Y-type WD0806–661B from Luhman et al. (2012, 2014) are shown together with J0855–0714 and three T8–T9 dwarfs for which we obtained F110W photometry in a similar manner as for our target (see the Appendix). J0855–0714 stands out as the reddest and faintest source. The 5 Gyr isochrone of Baraffe et al. (2003) is also shown. While it follows the trend pictured by the T dwarfs relatively well (despite the significant scatter in the observed data), the model is far from reproducing the extreme F110W−W2 color of cooler objects like our target, probably because of incorrect predictions for the F110W filter, which is very sensitive to water, methane, and ammonia absorption (see Fig. 2). While the massive near-infrared surveys like the VVV Survey (Minniti et al. 2010) are discovering interesting cool nearby objects (e.g., Beamín et al. 2013), the diagram of Fig. 5 reveals that the mid-infrared observations become critical for searching and characterizing the coldest planetary-mass objects. The near-infrared detections of J0855–0714 reported here are brighter than the limit of what could be detected by the Euclid5 mission, which is expected to reach ~24.5 mag in H band (3σ, AB system) for the wide survey (between 15 000 and 20 000 deg2) and two magnitudes fainter for the deep survey (40 deg2). The combination of Euclid and NEOWISE (Schneider et al. 2016b) data will be a very effective way of selecting brown dwarf and free-floating planet candidates as cold as J0855–0714.
Based on the mass functions of young clusters (e.g., Bayo et al. 2011; Peña Ramírez et al. 2012; Lodieu et al. 2013), we can estimate the number of J0855–0714-like objects populating the solar neighborhood by assuming that the mass distribution of stellar cluster members resembles that of the field population. In its power-law form (dN/dM~M− α), the mass function has a slope that probably lies in the interval α = 0.4–1 for the low-mass stellar and substellar regimes (see review by Luhman 2012). We expect as many J0855–0714-like free-floating planets as 0.075–0.15 M⊙ stars (spectral types ~M5–L2) in the solar vicinity. Considering the possible values of the mass function exponent, this estimate can change by a factor of two. Discovering them is indeed challenging and will open a new window to the study of planetary atmospheres. Ground- and space-based mid-infrared instruments have the potential of playing a significant role.
6. Conclusions
J0855–0714 is detected with a signal-to-noise ratio of ≈10 and ≈4 in the F110W and CH4-off bands of the WFC3 (HST) and Hawk-I (VLT) instruments. This is the first detection in the H-band wavelengths and the first >3σ ground-based detection at any wavelegnth. The comparison of the new photometry combined with the previously published data to current theoretical spectra computed for giant planets yields that J0855–0714 probably has a temperature of 225–250 K and a high surface gravity [log g ≃ 5 (cm s-2)]. J0855–0714 shows a red J−CH4-off color of 1.78 ± 0.61 mag in agreement with predictions of the high-gravity models and in marked contrast with the blue (negative) indices given by the low-gravity synthetic spectra. However, the log g ≃ 5 (cm s-2) obtained from the spectral fitting is not consistent with the predictions of evolutionary models of low-mass brown dwarfs and planets. For ages typical of the solar neighborhood (older than about 1 Gyr), the substellar evolutionary models envision a mass ranging from 2 to 10 MJup and gravities in the interval log g = 3.5−4.5 (cm s-2). If J0855–0714 had the age of the Sun, it would be a ≈5 MJup free-floating planetary-mass object. Based on the extrapolation of the stellar and substellar mass functions of young clusters, there might be as many J0855–0714-like sources in the solar neighborhood as low-mass stars with spectral types M5–L2. At distances <7 pc, we estimate that 15–60 J0855–0714-like objects may be present (based on the over 30 M5–L2 sources cataloged at a related distance from the Sun by the RECONS survey6). Discovering them is indeed challenging.
The Image Reduction and Analysis Facility (IRAF) is distributed by National Optical Astronomy Observatories, whcih is operated by the Association of Universities for Research in Astronomy, Inc., under contract with the National Science Foundation.
Jupiter fact sheet: http://nssdc.gsfc.nasa.gov/planetary/factsheet/jupiterfact.html
Euclid Definition Study Report (Red Book), ESA/SRE(2011)12.
Acknowledgments
Based on observations made with ESO telescopes at the La Silla Paranal Observatory under program ID 094.C-0048(A) retrieved from the ESO Science Archive Facility. Based on observations made with the NASA/ESA Hubble Space Telescope, obtained from the data archive at the Space Telescope Science Institute (STScI). STScI is operated by the Association of Universities for Research in Astronomy, Inc. under NASA contract NAS 5-26555. This research has made use of the Simbad and Vizier databases, operated at the Centre de Données Astronomiques de Strasbourg (CDS), and of NASA’s Astrophysics Data System Bibliographic Services (ADS). Current support for RECONS comes from the National Science Foundation. Our primary observing programs are carried out via the SMARTS Consortium, which operates four telescopes in the Chilean Andes under the auspices of National Optical Astronomy Observatory and the National Science Foundation. This research has been partly supported by the Spanish Ministry of Economy and Competitiveness (MINECO) under the grants AYA2014-54348-C3-2-R, AYA2015-69350-C3-2-P, and AYA2015-69350-C3-1. A.B. acknowledges financial support from the Proyecto Fondecyt de Iniciación 11140572. D.M. is supported by FONDECYT Regular No. 1130196, the BASAL CATA Center for Astrophysics and Associated Technologies PFB-06, and the Ministry for the Economy, Development, and Tourism’s Programa Iniciativa Científica Milenio IC120009, awarded to the Millennium Institute of Astrophysics (MAS). K.M. acknowledges the support of the ESO-Government of Chile Joint Committee. J.C.B. acknowledge support from CONICYT FONDO GEMINI – Programa de Astronomía del DRI, Folio 32130012. This work results within the collaboration of the COST Action TD 1308.
References
- Allard, F., Hauschildt, P. H., Alexander, D. R., Tamanai, A., & Schweitzer, A. 2001, ApJ, 556, 357 [NASA ADS] [CrossRef] [Google Scholar]
- Baraffe, I., Chabrier, G., Barman, T. S., Allard, F., & Hauschildt, P. H. 2003, A&A, 402, 701 [NASA ADS] [CrossRef] [EDP Sciences] [Google Scholar]
- Barrado y Navascués, D., Zapatero Osorio, M. R., Béjar, V. J. S., et al. 2001, A&A, 377, L9 [NASA ADS] [CrossRef] [EDP Sciences] [Google Scholar]
- Bayo, A., Barrado y Navscués, D., Stauffer, J. R., et al. 2011, A&A, 536, A63 [NASA ADS] [CrossRef] [EDP Sciences] [Google Scholar]
- Beamín, J. C., Minniti, D., Gromadzki, M., et al. 2013, A&A, 557, L8 [NASA ADS] [CrossRef] [EDP Sciences] [Google Scholar]
- Beamín, J. C., Ivanov, V. D., Bayo, A., et al. 2014, A&A, 570, L8 [NASA ADS] [CrossRef] [EDP Sciences] [Google Scholar]
- Buenzli, E., Marley, M. S., Apai, D., et al. 2015, ApJ, 812, 163 [NASA ADS] [CrossRef] [Google Scholar]
- Burgasser, A. J., Kirkpatrick, J. D., Cruz, K. L., et al. 2006, ApJS, 166, 585 [NASA ADS] [CrossRef] [Google Scholar]
- Burgasser, A. J., Gillon, M., & Faherty, J. K. 2014, ApJ, 785, 48 [NASA ADS] [CrossRef] [Google Scholar]
- Burrows, A., Sudarsky, D., & Lunine, J. I. 2003, ApJ, 596, 587 [NASA ADS] [CrossRef] [Google Scholar]
- Burrows, A., Sudarsky, D., & Hubeny, I. 2004, ApJ, 609, 407 [NASA ADS] [CrossRef] [Google Scholar]
- Casali, M., Pirard, J.-F., Kissler-Patig, M., et al. 2006, SPIE, 6269, 29 [Google Scholar]
- Chabrier, G., Baraffe, I., Allard, F., & Hauschildt, P. H. 2000, ApJ, 542, 464 [NASA ADS] [CrossRef] [Google Scholar]
- Chauvin, G., Lagrange, A.-M., Dumas, C., et al. 2005, A&A, 438, L25 [NASA ADS] [CrossRef] [EDP Sciences] [Google Scholar]
- Clarke, F. J., & Tinney, C. G., & Covey, K. R. 2002, MNRAS, 332, 361 [NASA ADS] [CrossRef] [Google Scholar]
- Cohen, M., Walker, R. G., Barlow, M. J., & Deacon, J. R. 1992, AJ, 104, 1650 [NASA ADS] [CrossRef] [Google Scholar]
- Currie, T., Burrows, A., Girard, J. H., et al. 2014, ApJ, 795, 133 [NASA ADS] [CrossRef] [Google Scholar]
- Dalton, G. B., Caldwell, M., Ward, A. K., 2006, SPIE Conf. Ser., 6269, 30 [NASA ADS] [Google Scholar]
- Emerson, J., McPherson, A., & Sutherland, W. 2006, The Messenger, 126, 41 [NASA ADS] [Google Scholar]
- Faherty, J. K., Burgasser, A. J., Walter, F. M., et al. 2012, ApJ, 752, 56 [NASA ADS] [CrossRef] [Google Scholar]
- Faherty, J. K., Tinney, C. G., Skemer, A., & Monson, A. J. 2014, ApJ, 793, L16 [NASA ADS] [CrossRef] [Google Scholar]
- Hewett, P. C., Warren, S. J., Leggett, S. K., & Hodgkin, S. T. 2006, MNRAS, 367, 454 [NASA ADS] [CrossRef] [Google Scholar]
- Holmberg, J., Nordstrom, B., & Andersen, J. 2009, A&A, 501, 941 [NASA ADS] [CrossRef] [EDP Sciences] [Google Scholar]
- Jarrett, T. H., Cohen, M., Masci, F., et al. 2011, ApJ, 735, 112 [NASA ADS] [CrossRef] [Google Scholar]
- Kissler-Patig, M., Pirard, J.-F., Casali, M., et al. 2008, A&A, 491, 941 [NASA ADS] [CrossRef] [EDP Sciences] [Google Scholar]
- Kopytova, T. G., Crossfield, I. J. M., Deacon, N. R., et al. 2014, ApJ, 797, 3 [NASA ADS] [CrossRef] [Google Scholar]
- Kraus, A. L., Cody, A. M., Covey, K. R., et al. 2015, ApJ, 807, 3 [NASA ADS] [CrossRef] [Google Scholar]
- Leggett, S. K., Morley, C. V., Marley, M. S., & Saumon, D. 2015, ApJ, 799, 37 [NASA ADS] [CrossRef] [Google Scholar]
- Lodieu, N., Dobbie, P. D., Cross, N. J. G., et al. 2013, MNRAS, 435, 2474 [NASA ADS] [CrossRef] [Google Scholar]
- Lodieu, N., Alonso, R., González Hernández, J. I., et al. 2015, A&A, 584, A128 [NASA ADS] [CrossRef] [EDP Sciences] [Google Scholar]
- Lucas, P. W., & Roche, P. F. 2000, MNRAS, 314, 858 [NASA ADS] [CrossRef] [MathSciNet] [Google Scholar]
- Lucas, P. W., Roche, P. F., Allard, F., & Hauschildt, P. H. 2001, MNRAS, 326, 695 [NASA ADS] [CrossRef] [Google Scholar]
- Luhman, K. L. 2012, ARA&A, 50, 65 [NASA ADS] [CrossRef] [Google Scholar]
- Luhman, K. 2013, ApJ, 767, L1 [NASA ADS] [CrossRef] [Google Scholar]
- Luhman, K. L. 2014, ApJ, 786, L18 [NASA ADS] [CrossRef] [Google Scholar]
- Luhman, K. L., & Esplin, T. L. 2014, ApJ, 796, 6 [NASA ADS] [CrossRef] [Google Scholar]
- Luhman, K. L., & Esplin, T. L. 2016, AJ, in press [Google Scholar]
- Luhman, K. L., Burgasser, A. K., Labbé, I., et al. 2012, ApJ, 744, 135 [NASA ADS] [CrossRef] [Google Scholar]
- Luhman, K. L., Morley, C. V., Burgasser, A. J., Esplin, T. L., & Bochanski, J. J. 2014, ApJ, 794, 16 [NASA ADS] [CrossRef] [Google Scholar]
- Mancini, L., Giacobbe, O., Littlefair, S. P., et al. 2015, A&A, 584, A104 [NASA ADS] [CrossRef] [EDP Sciences] [Google Scholar]
- Marsh, K. A., Kirkpatrick, J. D., & Plavchan, P. 2010, ApJ, 709, L158 [NASA ADS] [CrossRef] [Google Scholar]
- McMahon, R. G., Banerji, M., González, E., et al. 2013, The Messenger, 154, 34 [Google Scholar]
- Minniti, D., Lucas, P. W., Emerson, J. P., et al. 2010, New Astron., 15, 433 [NASA ADS] [CrossRef] [Google Scholar]
- Morley, C. V., Marley, M. S., Fortney, J. J., et al. 2014, ApJ, 787, 78 [NASA ADS] [CrossRef] [Google Scholar]
- Mužić, K., Scholz, A., Geers, V. C., & Jayawardhana, R. 2015, ApJ, 810, 159 [NASA ADS] [CrossRef] [Google Scholar]
- Nordstrom, B., Mayor, M., Andersen, J., et al. 2004, A&A, 418, 989 [NASA ADS] [CrossRef] [EDP Sciences] [Google Scholar]
- Oppenheimer, B. R., Kulkarni, S. R., Matthews, K., & van Kerkwijk, M. H. 1998, ApJ, 502, 932 [NASA ADS] [CrossRef] [Google Scholar]
- Peña Ramírez, K., Béjar, V. J. S., Zapatero Osorio, M. R., Petr-Gotzens, M. G., & Martín, E. L. 2012, ApJ, 754, 30 [NASA ADS] [CrossRef] [Google Scholar]
- Pirard, J.-F., Kissler-Patig, M., Moorwood, A., et al. 2004, SPIE, 5492, 1763 [Google Scholar]
- Reach, W. T., Megeath, S. T., Cohen, M., et al. 2005, PASP, 117, 978 [NASA ADS] [CrossRef] [Google Scholar]
- Saumon, D., & Marley, M. R. 2008, ApJ, 689, 1327 [NASA ADS] [CrossRef] [Google Scholar]
- Schneider, A. C., Cushing, M. C., Kirkpatrick, J. D., & Gelino, C. R. 2016a, ApJ, 823, L35 [NASA ADS] [CrossRef] [Google Scholar]
- Schneider, A. C., Greco, J., Cushing, M. C., et al. 2016b, ApJ, 817, 112 [NASA ADS] [CrossRef] [Google Scholar]
- Schultz, A., Noll, K., Barker, E., et al. 2005, NICMOS Instrument Handbook, Version 8.0 (Baltimore: STScI) [Google Scholar]
- Siebenmorgen, R., Carraro, G., Valenti, E., et al. 2011, The Messenger, 144, 9 [NASA ADS] [Google Scholar]
- Skrutskie, M. F., Cutri, R. M., Stiening, R., et al. 2006, AJ, 131, 1163 [NASA ADS] [CrossRef] [Google Scholar]
- Sudarsky, D., Burrows, A., Hubeny, I., & Li, A. 2005, ApJ, 627, 520 [NASA ADS] [CrossRef] [Google Scholar]
- Tinney, C. G., Faherty, J. K., Kirkpatrick, J. D., et al. 2014, ApJ, 796, 39 [NASA ADS] [CrossRef] [Google Scholar]
- Visscher, C., & Moses, J. I. 2011, ApJ, 738, 72 [NASA ADS] [CrossRef] [Google Scholar]
- Weights, D. J., Lucas, P. W., Roche, P. F., Pinfield, D. J., & Riddick, F. 2009, MNRAS, 392, 817 [NASA ADS] [CrossRef] [Google Scholar]
- Williams, P. K. G., & Berger, E. 2015, ApJ, 808, 189 [NASA ADS] [CrossRef] [Google Scholar]
- Wright, E. L., Mainzer, A., Kirkpatrick, J. D., et al. 2014, AJ, 148, 82 [NASA ADS] [CrossRef] [Google Scholar]
- Zapatero Osorio, M. R., Béjar, V. J. S., Martín, E. L., et al. 2000, Science, 290, 103 [NASA ADS] [CrossRef] [PubMed] [Google Scholar]
- Zapatero Osorio, M. R., Béjar, V. J. S., Martín, E. L., et al. 2014a, A&A, 572, A67 [NASA ADS] [CrossRef] [EDP Sciences] [Google Scholar]
- Zapatero Osorio, M. R., Béjar, V. J. S., Miles-Páez, P. A., et al. 2014b, A&A, 568, A6 [NASA ADS] [CrossRef] [EDP Sciences] [Google Scholar]
- Zapatero Osorio, M. R., Gálvez Ortiz, M. C., Bihain, G., et al. 2014c, A&A, 568, A77 [NASA ADS] [CrossRef] [EDP Sciences] [Google Scholar]
- Zhou, Y., Apai, D., Schneider, G. H., Marley, M. S., & Showman, A. P. 2016, ApJ, 818, 176 [NASA ADS] [CrossRef] [Google Scholar]
Appendix A: Additional material
Table A.1 provides the journal of the HST and VLT observations of J0855–0714 that are publicly available.
Figure A.1 displays the comparison of the J0855–0714 photometric SED with the theoretical spectra of Morley et al. (2014) computed for fsed = 5, h = 0.5 (half of the cloudy atmosphere is covered in holes), temperatures of 200–275 K, and two surface gravities (log g = 4.0 and 5.0 cm s-2). The best fit is given by the 225 K and log g = 5.0 cm s-2 model.
 |
Fig. A.1 Spectral energy distribution of J0855–0714 (red symbols) is compared with various planetary atmosphere models (gray lines) of Morley et al. (2014), all of which are computed for a 50% cloudy atmosphere. Arrows indicate upper limits. The observing filters are labeled. The models in the left and right columns are calculated for log g = 5.0 and 4.0 (cm s-2), respectively. The blue triangles represent the theoretical flux densities as integrated from the models using the corresponding filter passbands. All models are normalized to the emission of J0855–0714 at W2. |
We searched for public data of ≥T8 and Y-type dwarfs observed with the F110W filter and the WFC3 instrument onboard the HST to complement the color-magnitude diagram of Fig. 5. Several observations are available. In addition, we selected the ultra-cool dwarfs with trigonometric parallaxes available in the literature (Faherty et al. 2012; Tinney et al. 2014) and with a clear detection in the WFC3 data. Our search resulted in three T8–T9 dwarfs listed in Table A.2, for which we measured their F110W photometry in the same manner as for J0855–0714 (Sect. 2).
Journal of HST and VLT observations downloaded from their respective archives.
Additional F110W photometry.
All Tables
All Figures
|
Fig. 1 Identification of WISE J085510.74–071442.5 (at the center of the red circles) on the WFC3 and Hawk-I images sized 24′′ × 24′′. The observing dates and filters are indicated. North is up and east is to the left. |
| In the text | |
|
Fig. 2 Spectral energy distribution of J0855–0714 (red and black symbols). Circles denote positive detections and arrows indicate upper limits. The black symbols correspond to Schneider et al. (2016a) data. The horizontal error bars account for the width of the various filters. The filters are labeled. The best-fit planetary model atmosphere of Morley et al. (2014) computed as the average of Teff = 225 and 250 K, log g = 5.0 (cm s-2) and 50% cloudy conditions is also shown with a gray line. The blue triangles represent the theoretical flux densities as integrated from the models using the corresponding filter passbands (only for the filters in red). The new detections of J0855–0714 presented here correspond to F110W and CH4. The model is normalized to the emission of J0855–0714 at the wavelengths of the W2 filter. |
| In the text | |
|
Fig. 3 Color–color diagrams of J0855–0714 (red dot) including the synthetic indices (open circles) computed from the Morley et al. (2014) theoretical spectra. The high-gravity colors (log g = 5.0 cm s-2) are joined by a solid line, and the dashed line stands for the low gravity indices (log g = 4.0 cm s-2). All synthetic colors are labeled with their corresponding Teff (K). (CH4 stands for the CH4-off filter.) |
| In the text | |
|
Fig. 4 Evolution of the absolute W2 magnitude is shown for masses between 1 and 10 MJup (COND models; Baraffe et al. 2003). Each mass track is labeled with the Teff/log g pair values (K, cm s-2) corresponding to the different ages tabulated in the models. The J0855–0714 absolute W2 magnitude is bracketed by the two horizontal red lines (1σ). The blue shaded area indicates the most likely position of J0855–0714 based on its high surface gravity [log g ⪆ 3.5 (cm s-2)]. |
| In the text | |
|
Fig. 5 Color-magnitude diagram considering the F110W and W2 filters. Our F110W data are plotted as red symbols (J0855–0714 is labeled). Data from Burgasser et al. (2006) and Luhman et al. (2014) are shown with black circles and labeled with their spectral types. (We assumed that W2 ≈ [4.5] for the Y-dwarf WD0806–661B; Luhman et al. 2012, 2014. This assumption is based on the similarity of these two magnitudes in J0855–0714). The COND 5-Gyr evolutionary model of Baraffe et al. (2003) is depicted with a solid line. Masses in Jovian units predicted for the ages of 1, 5, and 10 Gyr are labeled at the right side. |
| In the text | |
|
Fig. A.1 Spectral energy distribution of J0855–0714 (red symbols) is compared with various planetary atmosphere models (gray lines) of Morley et al. (2014), all of which are computed for a 50% cloudy atmosphere. Arrows indicate upper limits. The observing filters are labeled. The models in the left and right columns are calculated for log g = 5.0 and 4.0 (cm s-2), respectively. The blue triangles represent the theoretical flux densities as integrated from the models using the corresponding filter passbands. All models are normalized to the emission of J0855–0714 at W2. |
| In the text | |
Current usage metrics show cumulative count of Article Views (full-text article views including HTML views, PDF and ePub downloads, according to the available data) and Abstracts Views on Vision4Press platform.
Data correspond to usage on the plateform after 2015. The current usage metrics is available 48-96 hours after online publication and is updated daily on week days.
Initial download of the metrics may take a while.