Fig. A.1
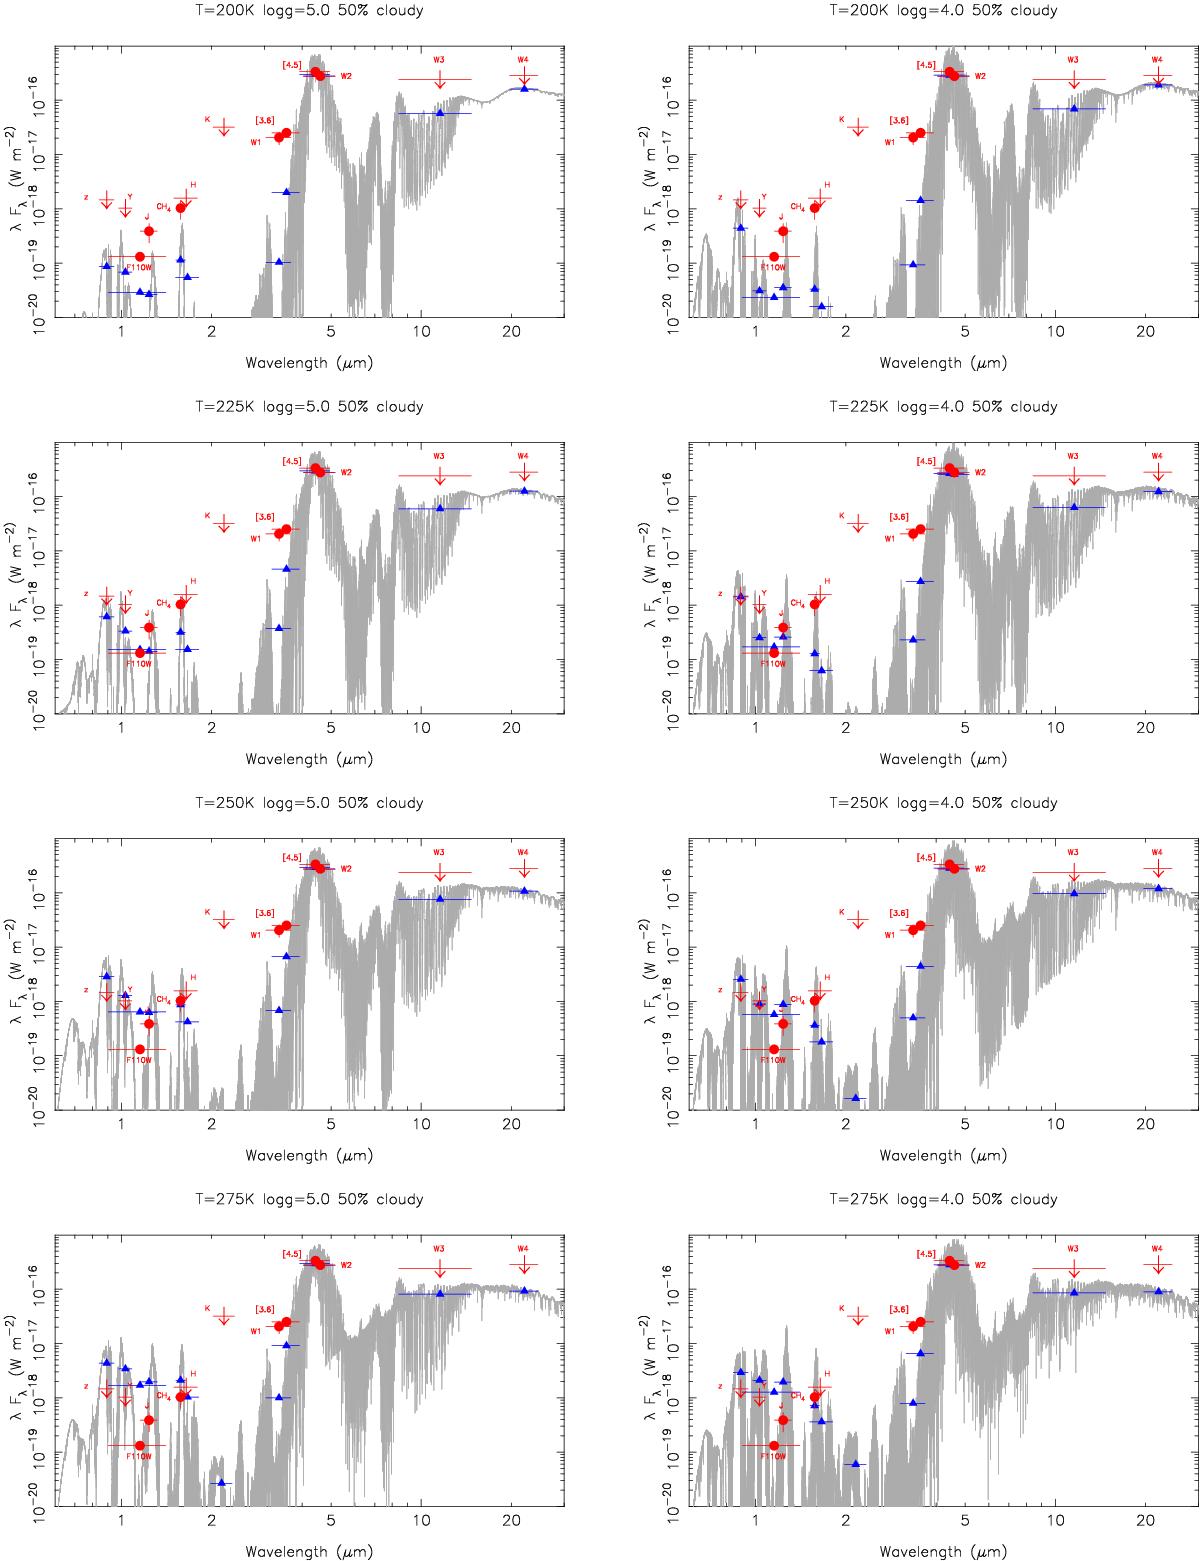
Spectral energy distribution of J0855–0714 (red symbols) is compared with various planetary atmosphere models (gray lines) of Morley et al. (2014), all of which are computed for a 50% cloudy atmosphere. Arrows indicate upper limits. The observing filters are labeled. The models in the left and right columns are calculated for log g = 5.0 and 4.0 (cm s-2), respectively. The blue triangles represent the theoretical flux densities as integrated from the models using the corresponding filter passbands. All models are normalized to the emission of J0855–0714 at W2.
Current usage metrics show cumulative count of Article Views (full-text article views including HTML views, PDF and ePub downloads, according to the available data) and Abstracts Views on Vision4Press platform.
Data correspond to usage on the plateform after 2015. The current usage metrics is available 48-96 hours after online publication and is updated daily on week days.
Initial download of the metrics may take a while.