Fig. 5
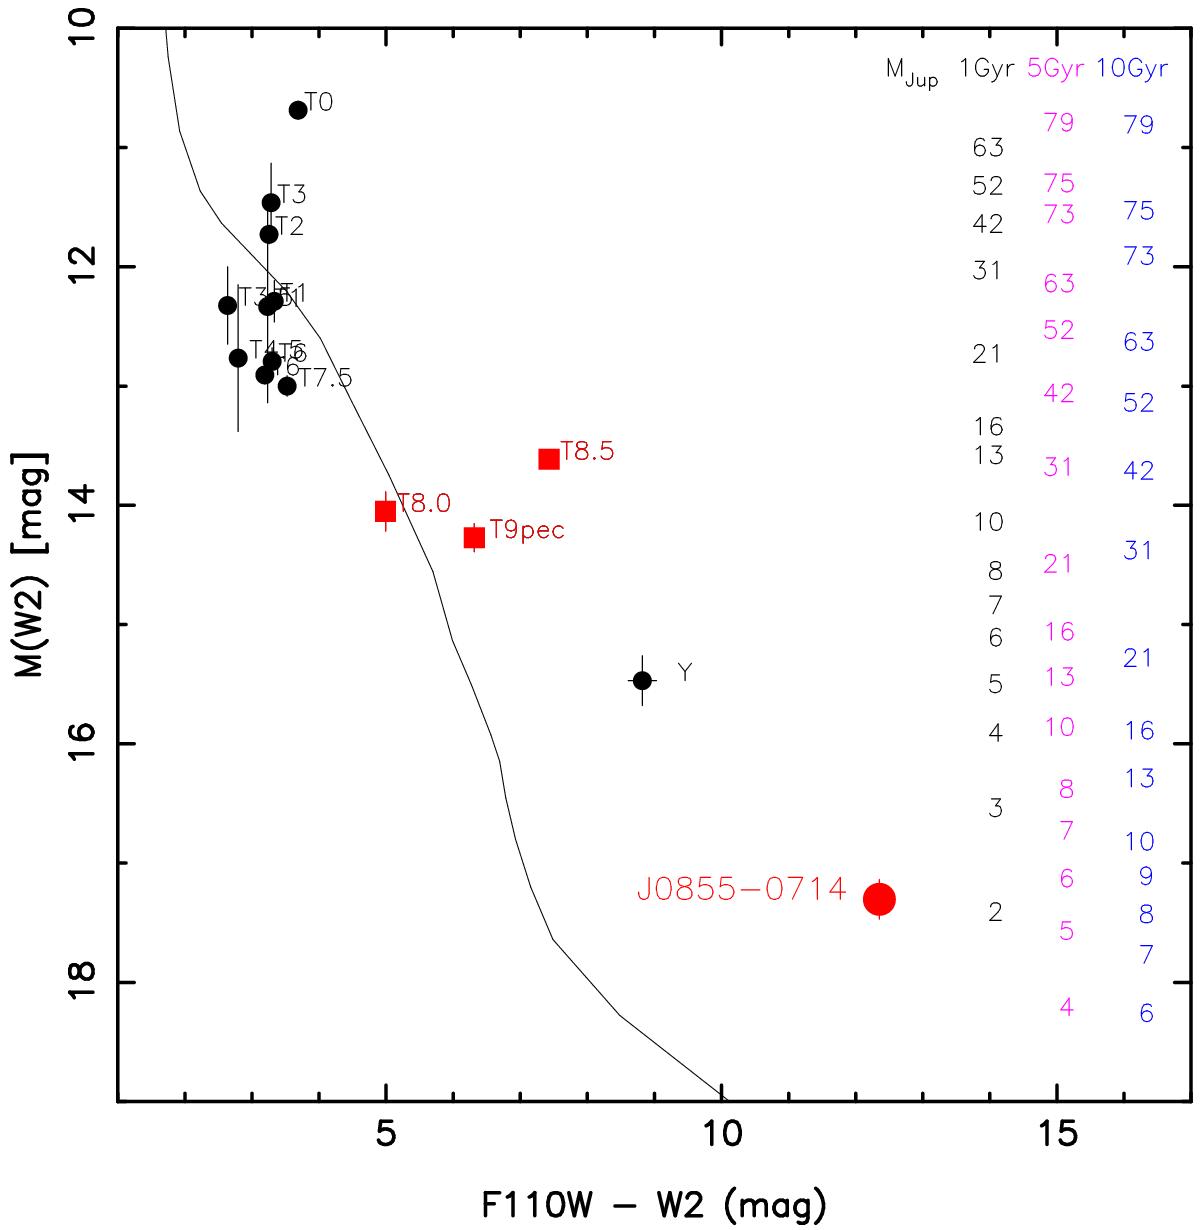
Color-magnitude diagram considering the F110W and W2 filters. Our F110W data are plotted as red symbols (J0855–0714 is labeled). Data from Burgasser et al. (2006) and Luhman et al. (2014) are shown with black circles and labeled with their spectral types. (We assumed that W2 ≈ [4.5] for the Y-dwarf WD0806–661B; Luhman et al. 2012, 2014. This assumption is based on the similarity of these two magnitudes in J0855–0714). The COND 5-Gyr evolutionary model of Baraffe et al. (2003) is depicted with a solid line. Masses in Jovian units predicted for the ages of 1, 5, and 10 Gyr are labeled at the right side.
Current usage metrics show cumulative count of Article Views (full-text article views including HTML views, PDF and ePub downloads, according to the available data) and Abstracts Views on Vision4Press platform.
Data correspond to usage on the plateform after 2015. The current usage metrics is available 48-96 hours after online publication and is updated daily on week days.
Initial download of the metrics may take a while.