Fig. 2
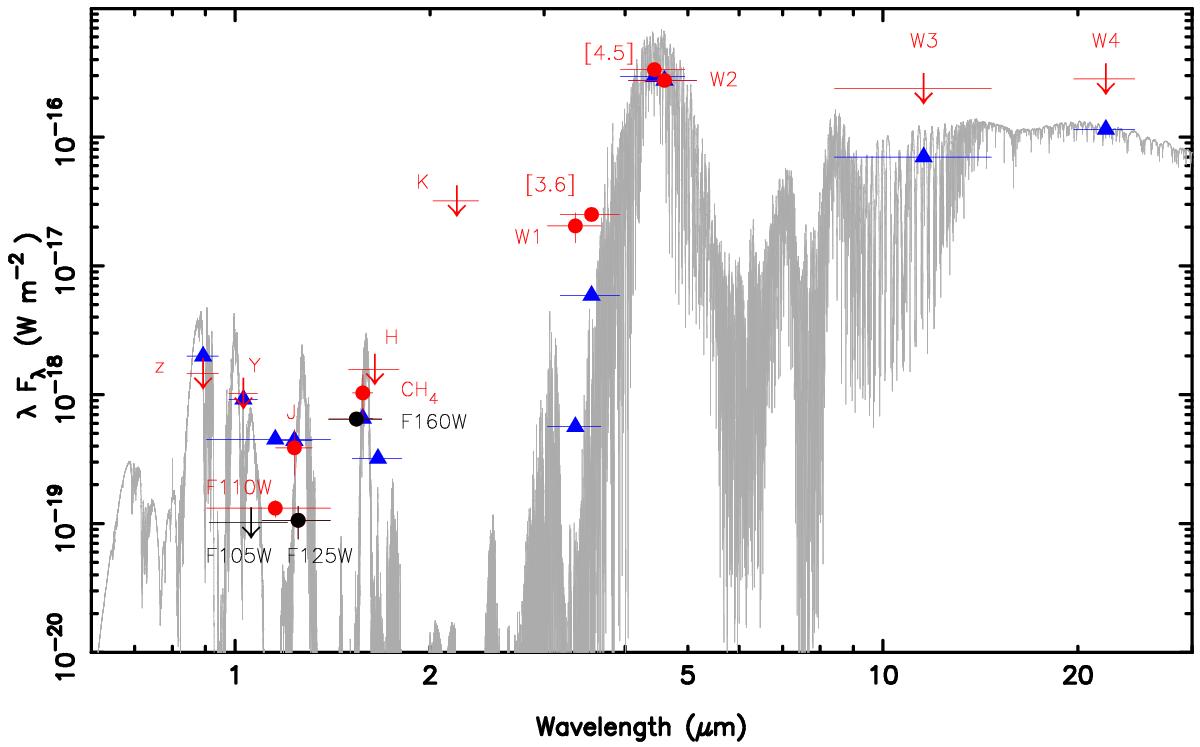
Spectral energy distribution of J0855–0714 (red and black symbols). Circles denote positive detections and arrows indicate upper limits. The black symbols correspond to Schneider et al. (2016a) data. The horizontal error bars account for the width of the various filters. The filters are labeled. The best-fit planetary model atmosphere of Morley et al. (2014) computed as the average of Teff = 225 and 250 K, log g = 5.0 (cm s-2) and 50% cloudy conditions is also shown with a gray line. The blue triangles represent the theoretical flux densities as integrated from the models using the corresponding filter passbands (only for the filters in red). The new detections of J0855–0714 presented here correspond to F110W and CH4. The model is normalized to the emission of J0855–0714 at the wavelengths of the W2 filter.
Current usage metrics show cumulative count of Article Views (full-text article views including HTML views, PDF and ePub downloads, according to the available data) and Abstracts Views on Vision4Press platform.
Data correspond to usage on the plateform after 2015. The current usage metrics is available 48-96 hours after online publication and is updated daily on week days.
Initial download of the metrics may take a while.