| Issue |
A&A
Volume 592, August 2016
|
|
|---|---|---|
| Article Number | A134 | |
| Number of page(s) | 12 | |
| Section | Stellar structure and evolution | |
| DOI | https://doi.org/10.1051/0004-6361/201527700 | |
| Published online | 15 August 2016 | |
Evolution of the stellar-merger red nova V1309 Scorpii: Spectral energy distribution analysis
1 Department of
Astrophysics, Nicolaus Copernicus
Astronomical Center, Rabiańska 8, 87-100 Toruń, Poland
e-mail: tylenda@ncac.torun.pl
2 European Southern Observatory,
Alonso de Córdova 3107,
Vitacura, Santiago,
Chile
e-mail: tkamisk@eso.org
Received:
5
November
2015
Accepted:
24
May
2016
Context. One very important object for understanding the nature of red novae is V1309 Sco. Its pre-outburst observations showed that, before its red-nova eruption in 2008, it was a contact binary quickly evolving to the merger of the components. It thus provided us with a direct evidence that the red novae result from stellar mergers.
Aims. We will study the evolution of the post-merger remnant of V1309 Sco over time.
Methods. We analyse the spectral energy distribution (SED) of the object and its evolution with time. From various optical and infrared surveys and observing programmes carried out with OGLE, HST, VVV, Gemini South, WISE, Spitzer, and Herschel we constructed observed SED in 2010 and 2012. Some limited data are also available for the red-nova progenitor in 2007. We analyse the data with our model of a dusty envelope surrounding a central star.
Results. Dust was present in the pre-outburst state of V1309 Sco. Its high temperature (900–1000 K) suggests that this was a freshly formed dust in a presumable mass-loss from the spiralling-in binary. Shortly after its 2008 eruption, V1309 Sco became almost completely embedded in dust. The parameters (temperature, dimensions) of the dusty envelope in 2010 and 2012 evidence that we then observed matter lost by the object during the 2008 outburst. Its mass is at least 10-3M⊙. The object remains quite luminous, although since its maximum brightness in September 2008, it has faded in luminosity by a factor of ~50 (in 2012). Far infrared data from Herschel reveal presence of a cold (~30 K) dust at a distance of a few thousand AU from the object.
Conclusions. Similarly to other red novae, V1309 Sco formed a slowly-expanding, dense, and optically-thick dusty envelope during its 2008 outburst. The main remnant is thus hidden for us. Far infrared data suggests that the object passed an episode of intense mass loss in its recent history. This conclusion could be verified by submillimeter interferometric observations.
Key words: circumstellar matter / stars: late-type / stars: individual: V1309 Scorpii / stars: mass-loss
© ESO, 2016
1. Introduction
The object V1309 Scorpii (V1309 Sco) was discovered as a ~9.5 mag possible nova on 2 September 2008 (Nakano et al. 2008). This relatively faint object did not elicit great interest from astrophysicists. It is enough to say that all the available photometric data for the object obtained during its outburst come from amateur astronomers.
Fortunately, Mason et al. (2010) observed the object spectroscopically. Suprisingly enough, these authors concluded that V1309 Sco was not a classical nova but rather an object similar to V838 Mon, which erupted in 2002 (Munari et al. 2002; Crause et al. 2003). Indeed, contrary to classical novae but similarly to V838 Mon, in course of the eruption, the object evolved to progressively later spectral types and declined as a late M-type giant. Stellar eruptions showing this kind of spectral evolution are now usually referred to as red novae or red transients, although other names, including luminous red novae, intermediate-luminosity optical transients, intermediate-luminosity red transients or V838-Mon-type objects, can be found in the literature.
Red novae form a rare class of stellar eruptions. Apart from V838 Mon and V1309 Sco, this class in our Galaxy includes V4332 Sgr (Martini et al. 1999) and OGLE-2002-BLG-360 (Tylenda et al. 2013). There is also growing observational evidence that CK Vul (Nova Vul 1670; Shara et al. 1985) was a red transient rather then a classical nova (Kato 2003; Tylenda et al. 2013; Kamiński et al. 2015a). Also, V1148 Sgr (Nova Sgr 1943) probably belonged to this class, as can be inferred from its spectral evolution described by Mayall (1949).
Two red novae have been identified in the Andromeda galaxy, M31 RV, which erupted in 1988 (Mould et al. 1990) and the very recent M31LRN 2015 (Williams et al. 2015; Kurtenkov et al. 2015). A few extragalactic objects, usually referred to as intermediate-luminosity optical transients, for example M85 OT2006 (Kulkarni et al. 2007), NGC 300 OT2008 (Bond et al. 2009; Berger et al. 2009), and SN 2008S (Smith et al. 2009), could also have been of a similar nature.
Historically, several mechanisms have been proposed to explain the red-transient events, including an unusual classical nova (Iben & Tutukov 1992), a late He-shell flash (Lawlor 2005), and a stellar merger (Soker & Tylenda 2003). They have been critically discussed in Tylenda & Soker (2006). These authors conclude that the merger of two stars is the only mechanism that can satisfactorily account for the observed properties of red novae.
Although not best observed in the eruption, V1309 Sco appeared to be a sort of Rosetta stone in understanding the nature of red novae. Thanks to the archive data from the optical gravitational lensing experiment (OGLE; Udalski 2003) it was possible to follow the photometric evolution of the object over the six years prior to the outburst (Tylenda et al. 2011a). The result was amazing: the progenitor of V1309 Sco was a contact binary quickly losing its orbital angular momentum and evolving to the merger of the components. Thus V1309 Sco provided us with a strong evidence that the red-nova events do indeed result from stellar mergers.
Because of its particular role in the field of red novae, V1309 Sco deserves careful observational monitoring and thorough study. However, in just a few years after its eruption the object became very faint in the optical (see e.g. Kamiński et al. 2015b). In addition, the object lies in a crowded field. As discussed in Kamiński et al. (2015b) and in the present paper, ground-based optical observations now suffer from contamination from nearby stars. This seriously hampers investigations of the present state of the object and its evolution. Nevertheless, Kamiński et al. (2015b) showed that V1309 Sco is now in a similar spectral state as V4332 Sgr was a few years after its 1994 eruption: the optical spectrum of V1309 Sco is now dominated by emission features from neutral atoms and molecules. As discussed in Kamiński et al. (2010) and Tylenda et al. (2015), this kind of a stellar spectrum can result from resonant scattering of the central star radiation by atoms and molecules in the circumstellar matter, if the central star is not directly visible. Indeed, in spite of the decline by about 10 mag in the optical, the object remained bright in the infrared (Nicholls et al. 2013). Thus the main remnant is now embedded in dust, although not completely. The atomic and molecular emission features provide evidence that in certain directions the central star radiation can escape without being significantly absorbed by dust.
In this paper we investigate the spectral energy distribution (SED) of V1309 Sco and its evolution with time. Our analysis is based on broadband photometric data compiled from various available sources and surveys (Sect. 2). We interprete the data with a simple model of a star embedded in a dusty envelope (Sect. 3). From fitting the model results to the observations we estimate the global parameters of the object, that is its luminosity, as well as temperature and dimensions of the dusty envelope (Sect. 4). This is the primary goal of our study. So far, luminosities of red novae and their remnants have primarily been derived from optical observations (see Tylenda et al. 2011a, for the case of V1309 Sco). As we discuss in Sect. 5, this approach can lead to serious underestimates of the total luminosity and overestimates of the rate of a red nova decline if the decline is accompanied with copious dust formation. The latter seems to be a rule rather than an exception in the red nova population. Hence the need for observational measurements in a wide range of the infrared wavelengths as basic ingredients in analyses of the red nova luminosities. We note that we are not aiming to investigate detailed dust properties, such as dust grain composition and dimensions. This would require detailed spectroscopic measurements in a wide range of the infrared wavelengths as well as a more sophisticated model of the dusty envelope than that used in our study. An attempt to analyse the chemical composition of dust grains in V1309 Sco was done in Nicholls et al. (2013).
2. Observational data
2.1. Herschel observations
Observations with the photodetector array camera and spectrometer (PACS) on board Herschel were executed on 19 March 2012 and arranged with two camera setups: (i) with blue (70 μm) and red (160 μm); and (ii) with green (100 μm) and red channels observed simultaneously. The observations were made in the mini scan mapping mode. For each of the two camera setups, two scans were made with scanning angles of 70° and 110°. A typical duration of a single scan was 5 min. The data were processed and averaged in each band with the standard PACS pipeline in the Herschel interactive processing environment (HIPE, version 10). We used reduction procedures optimised for aperture photometry of point sources. Aperture and colour corrections were applied to the measured flux densities which are listed in Table 1.
Fluxes of V1309 Sco measured with Herschel in March 2012.
Herschel also observed V1309 Sco using the spectral and photometric imaging receiver (SPIRE) on 1 March 2012. The observations were performed simultaneously in three bands, PSW, PMW, and PLW, which are centred at about 250, 350, and 500 μm, respectively. The small map mode was used with five repetitions. Total observing time was of about 15 min. Data were processed in HIPE-10 using the standard SPIRE pipeline for small maps. The source fluxes were measured using the time-line source extractor (profile-fitting procedure sourceExtractorTimeline in HIPE) optimised for point sources. The flux densities corrected for the pixelisation effect and colour-corrected ones are given in Table 1. The SPIRE maps in all the bands show an extended and diffuse emission in the field of V1309 Sco. V1309 Sco is located in a void (of a radius between about 0.́5 and 2′) of such emission in the two lower bands, at 250 and 350 μm. At 500 μm, however, where the angular resolution is lowest, the diffuse emission severely contaminates the position of V1309 Sco and no reliable measurements of the flux density were possible except a conservative upper limit (Table 1).
2.2. Mid-infrared observations
The field of V1309 Sco was covered by several surveys in the mid-IR range. On 19–20 March 2010, the all sky WISE Survey obtained scans in the four broadbands W1, W2, W3, and W4 at 3.4, 4.6, 12, and 22 μm, respectively. We extracted the survey images and source fluxes from the WISE all-sky release Catalog (Cutri et al. 2012). In the W1 and W2 bands, a blend of at least three sources is seen at the position of V1309 Sco, while at longer wavelengths, the source appears single and is dominated by the component that can be identified as V1309 Sco (see Fig. 1). Our analysis of the WISE images shows that the measurements for the source located at the position of V1309 Sco are not significantly affected by these nearby sources. The WISE magnitudes of V1309 Sco were converted to monochromatic fluxes of W1 = 122.88 ± 2.72 mJy and W2 = 668.25 ± 12.93 mJy, W3 = 2.347 ± 0.024 Jy, and W4 = 2.883 ± 0.035 Jy. These fluxes are slightly different than WISE fluxes provided in Nicholls et al. (2013), that were probably based on the preliminary version of the Catalog. Our values agree well with those given in McCollum et al. (2014).
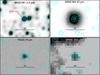 |
Fig. 1 Example images of the field around V1309 Sco in the mid-IR and far-IR. The origin and wavelength of each image is given at the top of each panel. All images are in scale and show the same part of the sky. Contours shown in all images are drawn for the emission in the W1 band of WISE. East is left, north is up. |
We add to our SED analysis mid-IR measurements obtained with TReCS (Telesco et al. 1998) at Gemini south in August 2010 and as reported in Nicholls et al. (2013). We found in the Canadian Astronomy Data Centre photometric observations with the same instrument from 6 June 2012 (PI I. Sakon). We reduced the data using the standard pipeline in IRAF Gemini package and performed aperture photometry. Data were calibrated using at least three standard stars in each filter. The results are given in Table 2.
Mid-IR observations at 3.6 and 4.5 μm with the Spitzer Space Telescope were reported in McCollum et al. (2014) for four dates in 2012. We include them in our analysis. We also add one extra measurement, included in Table 2, which was obtained within the same Spitzer project on 29 November 2013. To measure the fluxes on all Spitzer images from 2012–2013, we used standard pipeline-processed data and performed aperture photometry (McCollum et al. use profile photometry). The source was identified by comparing the field to multi-wavelength images at different epochs and measured in an aperture of 3′′ radius. The result was corrected for the sky background which was measured as a median within a large annulus surrounding the source aperture. An aperture correction was applied to the data but no colour correction was employed as it is expected to be very small. The results are included in Table 2. The standard deviation of the measurements at different dates are 2.3% and 15.8% at 3.6 and 4.5 μm, respectively. Additionally, the data-products we used are expected to have calibration errors at a level of about 10%. We note that the mir-IR fluxes of V1309 Sco, within the errors, did not change considerably over the period of 2012–2013. We should add that the source we measured covers positions of several optical stars, including a star ~2′′ north from V1309 Sco. This star dominates the flux at 3.6 μm what is apparent in the centroid position of the emission region. We were not able to disentangle the contributions of the different objects to the total unresolved flux and therefore the measurements at 3.6 μm should be treated as an upper level on the actual flux of V1309 Sco.
Measured optical, near-IR and mid-IR fluxes of V1309 Sco.
2.3. Near-infrared and visual observations
In the near-IR range, the position of V1309 Sco has been observed within the vista variables in the Via Lactea (VVV) ESO public survey (Minniti et al. 2010) in ZYJHKS bands. In the first data release of the survey, observations obtained from 21 May to 5 Sept. 2010 are available for this position, at least once in each of the five filters. Within the inner part of the PSF of the main source seen in the W1 band of WISE, two point-like sources are seen. The one centred close to the centroid of the emission seen in the W1 band of WISE is likely to be associated with V1309 Sco (see below). The other coincident source is located 1.̋9 north and partially blends with the component associated with V1309 Sco (see Fig. 2). VVV catalog entries, which include measurements from aperture photometry, in almost all cases, provide reliable fluxes for both sources separately, except the Z filter, in which the coincident source is considerably brighter than the V1309 Sco component resulting in no measurements for V1309 Sco in this filter. The fluxes for the source associated with V1309 Sco are given in Table 2.
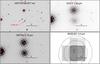 |
Fig. 2 Example images of the field around V1309 Sco at optical and near-IR wavelengths. All images are to scale and show the same part of the sky. The origin and wavelength of each image is given at the top of each panel. Contours in all images except that of W1, are shown for the optical emission in F673N. Contours in the WISE image correspond to the emission in the W1 band. East is left, north is up. |
We also extracted optical and near-IR images obtained with the wide field camera 3 (WFC3) of Hubble Space Telescope (HST) which were obtained on 19–20 February 2012. They include expositions in the F160W, F164N, and F673N filters whose central wavelengths (widths) are 1.54 μm (0.8 μm), 1.64 μm (0.7 μm), and 0.68 μm (42 Å), respectively. We analysed the standard, pipeline-processed images and performed aperture photometry, which was calibrated to flux units (Fν) using the information in the headers of the images. Small aperture sizes had to be used in this crowded field and therefore all measurements were corrected for the limited aperture size. Results of these measurements are included in Table 2. The superior angular resolution of the HST images allows us to see that the source measured in VVV images, and presumably also in other ground-based optical data, is actually a blend of several objects, with two strongest being of comparable brightness at optical wavelengths. The component that can be identified as V1309 Sco is the strongest near-IR source among those resolved sources and marked in Fig. 2.
The OGLE monitoring showed a systematic decline of V1309 Sco in 2010–2012 (Tylenda et al. 2011a; Kamiński et al. 2015b). Between March and September 2010 the object faded from I ≃ 16.15 to I ≃ 16.75. A few OGLE measurements in the V band showed a roughly constant brightness of ~20.1 mag over the 2010 season. In 2012 the object faded from I ≃ 17.1 to I ≃ 17.5. No measurement with the OGLE V filter was available from 2012, but, in this epoch, as discussed above, V1309 Sco was almost certainly dominated by nearby stars in this band. It is not excluded that the V measurements in 2010 and the Ic values in 2012 were also contaminated by field stars. The resultant fluxes from the OGLE observations are given in Table 2.
3. The model
The model of a star embedded in a dusty envelope used in the present study is an updated and modified version of that used in Tylenda et al. (2013) to model the SED of BLG-360. The major modification we have made to create the current version is that the dust envelope can be composed of up to three concentric shells, and that the shells are allowed to be truncated at a given elevation angle, αtrunc, above and below the equatorial plane. The multiple shells are meant to mimic an extended dust envelope with a radial gradient of the dust temperature, as well as to model different epochs of mass loss from the object. The truncation transforms a spherical shell into a torus-like structure. In this way we can simulate the result of an epoch, when mass loss was concentrated in the equatorial plane.
The progenitor of V1309 Sco was an eclipsing binary (Tylenda et al. 2011a), so we assume that the observer is at the orbital plane of the system.
The star, as in Tylenda et al. (2013), is parametrised by its spectral type (or its effective temperature Tstar) and radius Rstar (or luminosity Lstar). Its spectrum, Fλ,star is interpolated from a set of standard photometric colours, the same as in Tylenda (2005). The only difference is that the spectral type vs. effective temperature calibration was taken from Levesque et al. (2005) instead of that from Schmidt-Kaler (1982) used in Tylenda (2005).
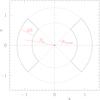 |
Fig. 3 XZ section of the dust shell geometry assumed in our modelling (Y axis is perpendicular to the figure). The shell of a thickness, ΔR, and a radius, Rs, is illuminated by a source in its centre. For α>αtrunc the shell is truncated, i.e. dust is present only within the full lines in the figure. The dust distribution is symmetrical in regard to the Z axis. The observer is in the XY plane. |
Each dusty shell is spherically symmetric relative to the star and its geometry is outlined in Fig. 3. The shell is parametrised by a dust temperature, Ts, an optical thickness in the V band along the line of sight of the central star,  , and a relative geometrical thickness of the shell, ΔR/Rs. The latter parameter was taken to be 0.5 in our calculations. The model results are not particularly sensitive to this parameter, unless αtrunc is small. Dust is isothermal and uniformly distributed in the shell. This last assumption greatly simplifies the radiative transfer in the envelope – the main reason why we adopted it. It cannot be justified on physical grounds, but we believe that it introduces smaller uncertainities in the global parameters of the object, for example total luminosity, than the unknown geometry of the dusty envelope.
The radius of the dust shell, Rs, is adjusted to fulfill the condition of thermal equilibrium, meaning that the shell emits a luminosity equal to that it absorbs from the incident radiation. In the case of the innermost shell the incident radiation is just that from the central star. The outer shell(s) receive(s) a sum of the stellar radiation attenuated by dust in the inner shell(s) and the radiation emitted by the inner shell(s), attenuated if there is a dust shell between the inner emitting shell and the outer absorbing one. Since the radius of a particular shell is usually much greater than the stellar radius and the radius(es) of the inner shell(s), the incident radiation is treated as that from a point source. Even in the case of models constructed for the progenitor phase (see Sect. 4.1), when the exciting source was a binary, this is a good approximation since the separation of the components (see Tylenda et al. 2011a) was then at least an order of magnitude smaller than the radius of the dusty shell.
Spectroscopic observations of V1309 Sco showed numerous molecular bands of oxides (Mason et al. 2010; Kamiński et al. 2015b), which indicates that the object is oxygen-rich, that is C/O < 1. Therefore, in our modelling, dust grains are assumed to be composed of silicates. Their optical properties have been taken from the calculations of Draine & Lee (1984), as tabulated in the web page of B. T. Draine1. These data refer to the interstellar dust population. However, as thoroughly discussed in Ossenkopf et al. (1992), the optical properties of circumstellar silicates and the interstellar silicates are similar. Grain sizes follow the standard a-3.5 distribution with an upper exponential cutoff at 1.0 μm. The absorption and scattering coefficients, Qabs and Qsca, as well as the anisotropy factor, g ≡ ⟨cosθ⟩, are obtained from integrating the corresponding optical properties over the grain-size distribution.
The incident radiation is absorbed and scattered in a given shell having an optical thickness,  . Thus, the incident spectrum, after having passed through the shell, is attenuated by a factor of
  . Outward scattering does not significantly attenuate the incident radiation, so we define an effective extinction coefficient as
 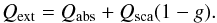 (1)The factor (1 − g) roughly accounts for the isotropic part of the scattering coefficient. The optical thickness in front of the star at a given wavelength, , is obtained from normalising Qext to at the V band. Note that the peak of the silicate feature is at λ = 9.4 μm in our dust model and that the optical thickness at this wavelength is equal to
  .
.
In order to calculate the outgoing emission from a given dust shell, we treat the shell as a circular slab or disc of radius Rs + 0.5 ΔR, resulting from projection of the spherical-shell dust distribution on a two-dimensional plane. At a given position on the disc, a local monochromatic intensity, Iλ, is then obtained from ![\begin{equation} \label{i_eq} I_\lambda = B_\lambda(T_{\rm s})\,[1 - \exp\,(-\tau_\lambda)], \end{equation}](/articles/aa/full_html/2016/08/aa27700-15/aa27700-15-eq55.png) (2)where Bλ is the Planck function and τλ is the local optical thickness of the disc. The outgoing monochromatic flux emitted by the shell is then obtained from integrating Iλ over the disc surface.
(2)where Bλ is the Planck function and τλ is the local optical thickness of the disc. The outgoing monochromatic flux emitted by the shell is then obtained from integrating Iλ over the disc surface.
If the shell is truncated at a given αtrunc above and below the equatorial plane, the integration of Eq. (2) is limited to the part of the disc surface being within the truncation limits. In this case, however, the shell radiates not only through the outer spherical border but also through two conical trancution surfaces. Each of them is estimated to have a surface  (3)and radiate away a monochromatic intensity
 ![\begin{equation} \label{ftr_eq} I_{\lambda}^{\rm tr} = B_\lambda(T_{\rm s})\,[1 - {\rm exp}(\tau_\lambda^{\rm tr})], \end{equation}](/articles/aa/full_html/2016/08/aa27700-15/aa27700-15-eq59.png) (4)where
(4)where  . As the observer is supposed to be at the equatorial plane, the radiation from the truncation surfaces is not included in the calculations of the observed spectrum.
At shorter wavelengths, scattering dominates absorption. To account for a random walk of photons in scattering dominated regions, we defined an effective absorption coefficient as 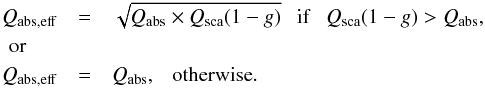 (5)The optical thickness of the shell disc in its centre at the effective wavelength of the V band,
  , is related to through
 (6)where Q...(V) stand for respective coefficients taken at the effective wavelength of the V band. The optical thickness of the disc centre at a given wavelength,
  , is then calculated from normalising Qabs,eff to
  at the effective wavelength of the V band. The effective thickness at any point of the disc, τλ, scales to as the dust surface density at the given point to that at the disc centre.
Finally, we leave a possibility that a certain part of the central star radiation can be observed as a result of scattering on dust even if the star is completely blocked in the line of sight. This is a likely situation if the mass outflow during and after the eruption was not spherically symmetric. We simulate it with a simple formula,  (7)where fscat is a free parameter in our model.
In summary, the models are specified by the following free parameters: Tstar, Rstar, fscat, and for each dust shell, Ts, , and αtrunc.
4. Results
The observational data on V1309 Sco described in Sect. 2 can be quite naturally grouped into two epochs, 2010 and 2012. We supplement the data given in Tables 1 and 2 with measurements published in the literature for these two epochs. When several measurements are available for a given photometric band, we take a mean value from them.
To make the analysis more complete, we also take near-IR Spitzer results obtained in May 2007 and published in McCollum et al. (2014), and supplement them with optical measurements from OGLE for the same time period. In this way, we can also investigate the SED in the pre-outburst state of V1309 Sco, although in a rather modest way.
Following Tylenda et al. (2011a), we assume that V1309 Sco is at a distance of 3 kpc and that it is reddened with EB − V = 0.8.
The observational data from the individual observational epochs are described in the following subsections and the adopted fluxes are given in Tables 4–6. The parameters of the models fitted to the data are given in Table 3. The input parameters are marked with asterisks. These values were varied to get a good fit to the observed fluxes. The rest of the parameters in the table are the values calculated from the models.
The upper rows of Table 3 present the parameters of the central star, that is the effective temperature and the corresponding spectral type, the effective radius and the resulting luminosity. All radii and luminosities given in the table are in the solar units. fscat is a scattering parameter, which is used in Eq. (7) to calculate the spectrum of the stellar radiation scattered on dust. The next two rows give the total observed luminosity of the model and the contribution of the directly observed radiation from the central star (attenuated by dust along the line of sight plus the scattered one) to the total observed lumonosity. The rest of the table presents the parameters of the dust shells, that is the dust temperature, the optical thickness of the shell in front of the star in the V band, and the truncation elevation angle of the shell (dust is present only between ± αtrunc in respect to the equatorial plane). The parameters of the shell, calculated in the models, include the radius, dust surface density (along the line of sight of the central star), mass of dust in the shell, and the contribution of the shell to the total observed luminosity.
A comparison of the model spectra with the observed fluxes is presented in Figs. 4–6. Note that no algorithm for finding the best fit was used. Therefore the models included in Table 3 and presented in the figures are not necessarily best reproducing the observations. The theory used in getting the models, as described in Sect. 3, was based on several approximations and simplifications, so we did not want to exaggerate by using sophisticated fitting procedures. We wanted to get a certain insight into the evolution of the object, so the figures given in Table 3 should be regarded as qualitative estimates of what was happenning in V1309 Sco during a few recent years.
The models (see text for explanations).
4.1. The progenitor in 2007
V1309 Sco was observed by the Spitzer Space Telescope IRAC camera on 10 May 2007 in four bandpasses centred at 3.6, 4.5, 5.8, and 7.8 μm. The data were reduced and published by McCollum et al. (2014).
V1309 Sco was monitored by the OGLE project in the Ic photometric band (Tylenda et al. 2011a). In May 2007, the mean brightness of the object was I = 15.8 ± 0.2. The uncertainty comes from the intrinsic variability of the object at that epoch. There were no OGLE measurements of the object in the V band during the whole 2007 observing season. We therefore adopt a V − I ≃ 2.15 colour measured by OGLE in 2006 (Tylenda et al. 2011a).
The resultant fluxes from the above sources are summarised in Table 4 and plotted as black symbols in Fig. 4.
The observed SED of the V1309 Sco progenitor in 2007 cannot be explained by a stellar spectrum only. A certain, although not dominating, excess in the near-IR is clearly present. Figure 4 shows the results of two models fitted to the observed points. The blue and red curves show model A and B, respectively, whose parameters are given in Table 3. The dotted curves show contributions from the star (having maximum at shorter wavelengths) and the dusty envelope (maximum at longer wavelengths). The full curves display the sum of the two components. Since we have no observational measurements at wavelengths longer than 10 μm, we have modelled the dust envelope with a single shell. Dust is relatively hot (Ts = 900−950 K) in the models. In model A, the shell is fully spherically symmetric (αtrunc = 90°). The shell is relatively transparent to the stellar radiation ( ). At first sight, the model spectrum fits well the observational points in Fig. 4. However, given the width of the Spitzer 7.8 μm bandpass (2.5 μm), the emission in the model 9.4 μm silicate band seems to be too strong compared to the observed fluxes. Indeed, an integration of the monochromatic flux from model A over the bandpass of the Spitzer 7.8 μm filter gives a flux of 7.3 mJy, which is almost twice as bright as the Spitzer measurement cited in Table 4.
Also the assumption of a uniform, spherically symmetric shell in model A does not seem to be reasonable in this particular case. This assumption requires a spherically symmetric wind from the progenitor. Assuming an outflow velocity of 100 km s-1 (escape velocity from a 1 M⊙ star with a 5 R⊙ radius is ~200 km s-1), the parametres of the model shell would imply a mass-loss rate of the order of 10-7M⊙ yr-1. This is certainly too a high value for a star of a ~10 L⊙ luminosity.
As shown in Tylenda et al. (2011a), the progenitor was intensively losing orbital angular momentum, at least since 2002. A part of this process was very likely due to mass loss via the outer Lagrangian point (L2) of the shrinking binary. This kind of mass loss is expected to form a geometrically thin disc at the orbital plane rather than a spherical envelope. Model B (see Table 3) is meant to illustrate this possibility. The dust shell is optically thick in the radial direction ( ) but, in the vertical direction, the dusty matter fills a disc-like structure with an opening angle of only
  . This dusty disc absorbs (and re-emits) only 6.3% of the central star luminosity, but, for an observer in the orbital plane, it hides 70% of the stellar surface. As can be seen from Fig. 4, model B reproduces the observations better than model A, as it does not produce an intense silicate band in emission.
Photometric fluxes for V1309 Sco in May 2007.
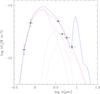 |
Fig. 4 Model fits to the photometric measurements of the V1309 Sco progenitor in May 2007 (black symbols – see Table 4). Blue curves represent model A. Red curves represent model B. The parameters of the models are given in Table 3. Dotted curves represent the contributions from the star (maximum at shorter wavelengths) and the dusty envelope (maximum at longer wavelengths). Full curves represent the sum of the two components. |
Apart from αtrunc = 90°, which was a priori adopted in this model, all the other parameters of model A are rather well constrained by fitting the model to the observations. To balance the infrared excess against the central star spectrum, a decrease of αtrunc requires an increase of . For instance, a model with αtrunc ≃ 20° requires  . To match the observed spectrum, the stronger absorption by dust requires that the central star is hotter (~G5 spectral type) and more luminous (~15 L⊙) compared to that in model A.
In model B, we adopted , in order to suppress the silicate emission feature at 9.4 μm. In fact, the feature is significantly suppressed for  . In this model, the vertical extension of the disc-like shell is smaller than the central star diameter, so the observed optical flux is dominated by the radiation from the parts of the star, which are directly observable above and below the disc. αtrunc was adjusted to balance the infrared dust emission to the observable stellar radiation. Note that the radiative losses of the shell are here dominated by radiation from the truncation sufaces (assumed to be invisible to the observer). Therefore the results of the model are somewhat sensitive to the adopted values of ΔR/Rs and . For instance, a model with ΔR/Rs = 1.0 and
  requires Lstar = 43 L⊙, Ts = 1100 K, and
  . The dust shell is then an order of magnitude more massive but twice as close to the star than in model B.
4.2. The remnant in 2010
Table 5 presents the fluxes compiled from various observations of V1309 Sco made between March and September 2010. Apart from the fluxes given in Table 2, we have also taken into account the results from Nicholls et al. (2013) and McCollum et al. (2014), when averaging the fluxes for a particular band. The uncertainties of the resultant fluxes given in Table 5 include not only estimated precisions of individual measurements but also discrepancies between the results from different sources. The fluxes listed in Table 5 are plotted with black symbols in Fig. 5.
Representative photometric fluxes for V1309 Sco in 2010.
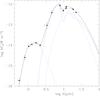 |
Fig. 5 Model spectrum compared to the photometric measurements of V1309 Sco in 2010 represented with the black symbols (see Table 5). Dashed and dotted blue curves show contributions of the central star and the two dust shells to the final model spectrum displayed with the full curve. Parameters of the model can be found in Table 3 (fourth column). |
As can be seen from Fig. 5, the SED of V1309 Sco in 2010 was dominated by infrared emission. The optical and near-IR component, which can be interpreted as a contribution from the central star, accounts only for ~2% of the total observed flux from the object (see Table 3). Clearly the main remnant of the 2008 eruption is almost completely embedded in dust. The situation is quite similar to that observed in the remnant of V4332 Sgr (Kamiński et al. 2010). As shown in Kamiński et al. (2010) and Kamiński & Tylenda (2013), the minor stellar-like contribution observed in V4332 Sgr is most likely caused by scattering of the central-star radiation on dust grains in an aspherical, optically thick envelope rather than by a direct showing of the central star through a partly translucent envelope. We adopt that a similar geometry, as in V4332 Sgr, is also observed in the remnant of V1309 Sco, namely that the dusty envelope is somewhat concentrated near the equatorial plane, while the central-star radiation can relatively easily escape along polar directions, giving rise to the scattered stellar-like component, as well as the atomic and molecular emission features, as observed by Kamiński et al. (2015b). Note that the suggested geometry of the dusty envelope is consistent with what is expected to result from a merger of a binary system, that is a dense, relatively slow mass loss concentrated near the orbital plane with possible thinner but faster bipolar outflows in polar directions (similarly to that modelled in Akashi et al. 2015).
The infrared SED observed in 2010 displays a clear 9.4 μm silicate feature in absorption (see Fig. 5). This cannot be modelled by an isothermal dusty envelope. The feature evidently shows that the envelope has a temperature gradient with outer cooler dust superimposed on inner hotter layers forming a sort of an infrared photosphere. We model this situation with two isothermal shells: the inner optically thick and hotter shell is surrounded by a cooler one of moderate optical thickness. Following the above discussion the shells are not completely spherically symmetric. We adopted that they are truncated at αtrunc = 45°. The parameters of our model can be found in the fourth column of Table 3, while the resultant model spectrum is compared to the observations in Fig. 5. The optical thickness of the inner shell was quite arbitrarily assumed to be  . In fact the model spectrum remains practically the same for any
  . The contribution of the model central star to the observed spectrum (left blue dotted curve in Fig. 5) is due to scattering on dust grains calculated from Eq. (7). The part of the SED dominated by this contribution, λ ≲ 2.2 μm, was used to estimate the spectral type (effective temperature) of the central star (see Table 3).
As mentioned above, we have adopted αtrunc = 45° for both dust shells in our model. This parameter mainly affects the ratio between the luminosity of the central star and the observed luminosity of the object (Lstar/Lobs). In the presented model this ratio is 2.12 (see Table 3). This value partly results from the fact that ~30% of the stellar radiation does not interact with the dust shells at all, as it escapes through the polar cones limited by αtrunc. The rest is due to radiative losses through the truncation surfaces of the shells. Obviously, the ratio decreases to 1.0 when αtrunc approaches 90°. On the other hand, if we assume αtrunc = 25°, Lstar/Lobs increases to 4.8. From the other model parameters only the radius of the inner dust shell is sensitive to αtrunc, as it varies proprtionally to Rstar ( ).
).
4.3. The remnant in 2012
Table 6 presents the fluxes resultant from various observations of V1309 Sco made in 2012. The values are primarily based on the fluxes given in Tables 1 and 2. In the case of the data from HST, Table 6 gives a mean value derived from the fluxes obtained with the F160W and F164N filters. We have also taken into account the fluxes obtained by McCollum et al. (2014). The uncertainties of the resultant fluxes given in Table 6 take into account discrepancies between the results for the same band from different sources, as well as estimated precisions of individual measurements. The fluxes listed in Table 6 are plotted with black symbols in Fig. 6.
Representative photometric fluxes for V1309 Sco in 2012.
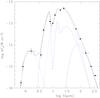 |
Fig. 6 Model spectrum compared to the photometric measurements of V1309 Sco in 2012 represented with the black symbols (see Table 6). Dashed and dotted blue curves show contributions of the central star and the dust shells to the final model spectrum displayed with the full curve. Parameters of the model can be found in Table 3 (fifth column). |
As can be seen from Fig. 6, the SED of V1309 Sco in 2012 is qualitatively similar to that in 2010 shown in Fig. 5. The direct contribution of the central star radiation in the optical and near-IR remains minor compared to the dominating infrared part of the SED produced by dust. The 9.4 μm feature is in a deep absorption.
Our model fits to the observations (see Table 3) however show a noticeable evolution of the object between 2010 and 2012. The central star cooled off by ~300 K and evolved from M6 to an M8 spectral type. The dusty envelope expanded, as well as, cooled off. Finally, the object faded in its global luminosity.
The 300 K drop in Tstar between 2010 and 2012 may seem, at first sight, as being too small to be considered as reliablely estimated from the observational data. However the slope of the stellar spectrum in the optical is very sensitive to Tstar in the M-type spectral range. In particular the HST (F160 /F673) colour observed in 2012 is significantly greater than that predicted by a model having the same stellar temperature as the 2010 model, that is Tstar = 3300 K. Therefore, provided that the scattering properties of dust did not significantly change in mean time, the derived difference in the central star temperature between 2010 and 2012 is realistic.
We have not been able to satisfactorily model the observed SED in 2012 with two dust shells as we did in 2010. The reason for this is that for 2012 we have far-IR measurements from Herschel showing an excess in this region (no data from this spectral domain was available in 2010). A two-shell model fitted to the optical, near- and mid-IR data in 2012 underestimates the observed far-IR flux and the difference progressively increases with the wavelength. At 340 μm the model underestimates the flux by a factor of ~12. Therefore, to reproduce the far-IR observations in 2012, we have added a third, cold, optically thin and distant shell (see Table 3). As discussed in Sect. 5.1, this dust presumably resulted from a distant-past mass loss from the progenitor, so it must have contributed to the observed extinction of the object in 2007 and 2010. As this contribution was explicitly taken into account in the 2012 model, we have decreased the interstellar reddening, EB − V, from 0.8 to 0.72, when fitting the results of this model to the observations.
Note that the parameters of Shell 3 are poorly estimated. First of all, the shape of the spectrum in the far-IR suggests that a multi-temperature region would fit the data better than an isothermal shell. Second, we adopted the same geometry, that is the same value of αtrunc, for the three shells, which need not to be the case. For instance, a model with αtrunc = 10° for Shell 3 requires  and results in Ms,dust = 3.6 × 10⁻⁴ M⊙. The radius of the shell remains however practically unchanged.
5. Discussion
The study of the SED of V1309 Sco made in Sect. 4 on the basis of the observational data described in Sect. 2 provided us with important information on the dusty matter surrounding the object, as well as on the luminosity of the object. These two subjects are discussed below in more detail.
5.1. Dust
Dust has dominated the observational appearances of V1309 Sco after its 2008 eruption. It is impossible to understand correctly the evolution of the object without taking into account dust.
However, as we show in Sect. 4.1, dust was also present in the progenitor phase of the object. A possible presence of circumstellar matter in the progenitor of V1309 Sco was already considered in Tylenda et al. (2011a). Those authors suggested that the optical fading by ~1 mag observed in course of a year preceding the 2008 outburst was due to an increasing mass loss rate from the shrinking binary progenitor, presumably by its outer Lagrangian point. With the observational data analysed in Sect. 4.1 we have direct evidence of dust presence in the progenitor. As argued in Sect. 4.1, the dusty matter was probably concentrated near the orbital plane of the binary progenitor. The accelerating shrinkage of the binary (see Fig. 2 in Tylenda et al. 2011a) most likely resulted in an increasing mass loss rate and a thickening of the dusty disc. In our model 2007 B, ~70% of the photosphere of the progenitor was hidden for us behind the disc. An increase of the vertical thickness of the disc by 20% would account for the observed optical decay of the object by a factor of 2.5 between April 2007 and March 2008 (Tylenda et al. 2011a).
We can easily see from Table 3 that dust observed in 2010 and 2012 cannot be the same that was seen in the progenitor in 2007. First, the dust mass required to model the SED of the remnant is several orders of magnitude greater than that in models 2007 A and B. Second, the estimated radius of the dusty envelope or disc of the progenitor, ~130 R⊙, was significantly smaller than the effective radius of the object near the maximum brightness in 2008, ~300 R⊙ (Tylenda et al. 2011a). Thus dust of the progenitor was likely to have been destroyed during the eruption. Dust seen in the remnant must therefore have been formed during or after the 2008 eruption. Presumably it took place in matter lost during the eruption, when it expanded and sufficiently cooled off for dust grains to be formed. Following the discussion in Sect. 5.2, we can say that dust started being formed at the beginning of the fast optical decline, that is the end of September – beginning of October 2008.
We have used up to three dust shells in our models of V1309 Sco in the remnant phase in 2010 and 2012. As we discuss below, the first two shells represents the dusty matter ejected by the object during the 2008 outburst. The outhermost third shell in the 2012 model probably shows existence of much older dust in the vicinity of V1309 Sco.
Dividing the dimensions of the two dust shells in our model constructed to interpret the observations made in 2010 (see Table 3) by the time elapsed since the 2008 outburst we get velocities of ~40 and ~70 km s-1. These values, especially the second one, are nicely within the range of expansion velocities observed during the 2008 eruption (Mason et al. 2010). Repeating the same calculations for the inner shells in the 2012 model, one gets ~20 and ~70 km s-1. The apparent deceleration of Shell 1 in the models can be easily understood in terms of a decreasing opacity in outer regions of the ejecta due to their expansion. The optically thick Shell 1 represents dense inner regions where a sort of an infrared photosphere is formed. In the expanding envelope its position is expected to recede in respect to the outflowing matter. The partially transparent Shell 2 represents a sort of an atmosphere in the expanding dusty matter. As the photosphere recedes with time the mass of the atmospheric regions should increase. Indeed, the mass of Shell 2 in our models increased by a significant factor between 2010 and 2012.
The mass ejected by V1309 Sco during its eruption cannot be determined from our modelling of the SED, as the dusty envelope is evidently optically thick. The mass of Shell 1 depends on the optical thickness of the shell. As discussed in Sect. 4.2, this parameter is uncertain since the observed spectrum is insensitive to the optical thickness if it is greater than ~20. However a lower limit can be estimated from the dust mass of Shell 2 in the models, as this shell represents observable dust. Adopting the standard dust-to-gas mass ratio of 0.01, we find from the parameters of the 2012 model (see Table 3) that V1309 Sco lost at least 10-3M⊙.
The only measurements of V1309 Sco in the far-IR are those made by Herschel in March 2012 (see Sect. 2.1). Our model fitted to all the data available in 2012 (see Table 3) suggests existence of a cold dust at a typical distance of ~5000 AU. It is unlikely that this cold dust could have been produced by the 2008 eruption, because its distance from the central object would imply an unrealistically high outflow velocity. More probably this matter resulted from mass loss in the past history of the progenitor of V1309 Sco. The progenitor was an interacting (contact) binary, whose both components, according to Stȩpień (2011), had already left the main sequence. One may speculate, following the model of Stȩpień (2011), that the moment when the expanding, more massive component was approaching its Roche lobe, occured quite recently (in terms of the stellar-evolution time-scale). This phase might have beeen accompanied by dynamical effects related to intense angular momentum transfer between the orbit and the rotation of the components, which might have triggered an intense mass loss from the system.
At a distance of 3 kpc the dimensions of Shell 3 in our 2012 model would imply an angular diameter of 3–4″. This should be resolved in observations using submillimeter interferometers, e.g. ALMA.
5.2. Luminosity
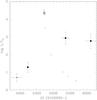 |
Fig. 7 Luminosity of V1309 Sco plotted versus time in Julian dates. Full symbols indicate values derived in the present study. The asterisk indicates luminosity of the progenitor estimated in Tylenda et al. (2011a). Open symbols indicate luminosities during the eruption (big symbols) and decline (small symbols) derived in Tylenda et al. (2011a). See text for more explanations. |
The estimates of the luminosity of V1309 Sco done in Sect. 4 are one of the most valuable results of the present study. For a general discussion, we compare them, in Fig. 7, with those obtained in Tylenda et al. (2011a) from optical observations only.
For the progenitor in May 2007 we obtained two values, depending on which model of the dust distribution we used. Models A and B, described in Sect. 4.1 (see Table 3), present extreme cases of the dust geometry, that is spherically symmetric shell versus geometrically thin disc. Thus the resultant luminosites can also be considered as limiting values. Therefore the black symbol at JD = 2 454 240 in Fig. 7 shows a mean value from these two estimates of Lstar for May 2007 in Table 3, while the vertical error bar shows the difference between them.
The results obtained in Sects. 4.2 and 4.3 from the observations made in 2010 and 2012 are plotted in Fig. 7 at JD = 2 455 360 and 2 456 120, respectively. The full symbols in the figure represent Lstar from Table 3. The values of Lobs in the table can be considered as lower limits to the luminosity of the object. The difference between Lstar and Lobs is thus taken as an estimate of the uncertainty of the luminosity of V1309 Sco.
The leftmost asterisk symbol in Fig. 7 refers to an estimate of the luminosity of the V1309 Sco progenitor in 2006 made in Tylenda et al. (2011a). This estimate is model dependent, as it was done assuming that the binary components of the progenitor were filling their Roche lobes. In fact this luminosity estimate was used in Tylenda et al. (2011a) to estimate the distance to the object (~3 kpc, a value also adopted in the present study). When comparing to our analysis of the May 2007 data, one can conclude that the V1309 Sco progenitor brightened by a factor of approximately four between 2006 and 2007. The optical light curve presented in Tylenda et al. (2011a) shows that the object indeed brightenned between these dates but by ~0.35 mag, that is a factor of ~1.4, only. The reason for this discrepancy is that we attempted to account for the observed infrared excess in May 2007. Unfortunately, the result is sensitive to the adopted model of dust distribution. A fit of a pure stellar spectrum (no dust contribution) to the V and I fluxes in Table 4 gives Lstar = 7.1 L⊙, which is 1.42 times the luminosity derived in Tylenda et al. (2011a). As discussed in Sect. 5.1, the role of dust in the progenitor increased with time, affecting more and more importantly the optical appearances of the object, when it was approaching the merger. Therefore the rise of the object in the bolometric luminosity during the final years before the 2008 eruption was probably steeper than that of the optical brightness observed in Tylenda et al. (2011a). As discussed in Tylenda et al. (2011a), dissipation of the orbital energy of the shrinking binary can easily account for the brightening of the V1309 Sco progenitor, even if this brightening was more significant than that directly inferred from the optical lightcurve.
Figure 7 shows the luminosities derived in Tylenda et al. (2011a) from optical measurements. The phase of maximum brightness of the object observed between 9 and 28 September 2008, and the decline after the 2008 eruption are both indicated. As is clearly seen from Fig. 7, the optical data seriously overestimate the decline rate of the object. The optical decline was largely due to formation of dust. When the infrared data are taken into account we have to conclude that a few years after the eruption V1309 Sco is still relatively bright. It has significantly faded in meantime but between two and three orders of magnitude less than inferred from the optical data in Tylenda et al. (2011a). From the low fading rate observed between 2010 and 2012 we can anticipate that the object will remain luminous for many decades.
The luminosity evolution of V1309 Sco is in fact similar to what is observed in other red novae. V4332 Sgr, very similarily to V1309 Sco, developed a huge infrared excess after its 1994 eruption (Kamiński et al. 2010). When this is taken into account, one can conclude that since the eruption V4332 Sgr has faded by a factor of ~30 rather than 1500 as was inferred from the optical data only in Tylenda et al. (2005). The infrared excess of V838 Mon is much less dominant than those of V4332 Sgr and V1309 Sco, so the optical data give more reliable estimates of the luminosity. A recent study of Tylenda et al. (2011b) shows that in 2009 V838 Mon was a factor of ~60 fainter than at its maximum in 2002. Our present study shows that in 2012 V1309 Sco was some 50 times less luminous than at its maximum in 2008.
6. Conclusions
Shortly after its 2008 eruption, V1309 Sco formed a slowly-expanding, dense, and optically-thick dusty envelope. Its mass is at least 10-3M⊙. As a result of dust formation, the optical decline was much faster and deeper than that of the bolometric luminosity of the object. The main remnant is now hidden for us. The cases of V4332 Sgr and CK Vul tell us that it may remain invisible for decades or even hundreds of years. In 2012, V1309 Sco remained quite luminous, although since its maximum brightness in September 2008, it had faded by a factor of ~50.
Dust was also present in the pre-outburst state of the object. Its high temperature (900–1000 K) suggests that this was a freshly formed dust. This was indicative of mass loss from the spiralling-in binary, presumably by its outer Lagrandian point, L2.
Far infrared data from Herschel reveal the presence of a cold (~30 K) dust at a distance of a few thousand AU from the object. This suggests that the object passed an episode of intense mass loss in its recent history. Submillimeter interferometric observations would be able to verify this conclusion.
Acknowledgments
We are greatful to the referee (A. Evans), whose comments helped us to significantly improve the quality of the paper. This publication makes use of data several products: from the NASA/IPAC Infrared Science Archive, which is operated by the Jet Propulsion Laboratory, California Institute of Technology, under contract with the National Aeronautics and Space Administration (NASA); from the Wide-field Infrared Survey Explorer, which is a joint project of the University of California, Los Angeles, and the Jet Propulsion Laboratory/California Institute of Technology, funded by NASA; from the Cambridge Astronomical Survey Unit; from the NASA/ESA Hubble Space Telescope, obtained from the data archive at the Space Telescope Science Institute. STScI is operated by the Association of Universities for Research in Astronomy, Inc. under NASA contract NAS 5-26555; from the Gemini Observatory (projects GS-2010B-C-7, GS-2011B-C-4, GS-2012A-C-5, acquired through the Gemini Science Archive and processed using the Gemini IRAF package), which is operated by the Association of Universities for Research in Astronomy, Inc., under a cooperative agreement with the NSF on behalf of the Gemini partnership: the National Science Foundation (United States), the National Research Council (Canada), CONICYT (Chile), the Australian Research Council (Australia), Ministério da Ciência, Tecnologia e Inovação (Brazil) and Ministerio de Ciencia, Tecnología e Innovación Productiva (Argentina). This research used the facilities of the Canadian Astronomy Data Centre operated by the National Research Council of Canada with the support of the Canadian Space Agency.
We acknowledge all these institutions.
References
- Akashi, M., Sabach, E., Yogev, O., & Soker, N. 2015, MNRAS, 453, 2115 [NASA ADS] [CrossRef] [Google Scholar]
- Berger, E., Soderberg, A. M., Chevalier, R. A., et al. 2009, ApJ, 699, 1850 [NASA ADS] [CrossRef] [Google Scholar]
- Bond, H. E., Bedin, L. R., Bonanos, A. Z., et al. 2009, ApJ, 695, L154 [NASA ADS] [CrossRef] [Google Scholar]
- Crause, L. A., Lawson, W. A., Kilkenny, D., et al. 2003, MNRAS, 341, 785 [NASA ADS] [CrossRef] [Google Scholar]
- Cutri, R. M., et al. 2012, VizieR Online Data Catalog: II/311 [Google Scholar]
- Draine, B. T., & Lee, H. M. 1984, ApJ, 285, 89 [Google Scholar]
- Iben, I. Jr., & Tutukov, A. V. 1992, ApJ, 389, 369 [NASA ADS] [CrossRef] [Google Scholar]
- Kamiński, T., & Tylenda, R. 2013, A&A, 558, A82 [NASA ADS] [CrossRef] [EDP Sciences] [Google Scholar]
- Kamiński, T., Schmidt, M., & Tylenda, R. 2010, A&A, 522, A75 [NASA ADS] [CrossRef] [EDP Sciences] [Google Scholar]
- Kamiński, T., Menten, K. M., Tylenda, R. et al. 2015a, Nature, 520, 322 [NASA ADS] [CrossRef] [PubMed] [Google Scholar]
- Kamiński, T., Mason, E., Tylenda, R., & Schmidt, M. 2015b, A&A, 580, A34 [NASA ADS] [CrossRef] [EDP Sciences] [Google Scholar]
- Kato, T. 2003, A&A, 399, 695 [NASA ADS] [CrossRef] [EDP Sciences] [Google Scholar]
- Kulkarni, S. R., Ofek, E. O., Rau, A. et al. 2007, Nature, 447, 458 [Google Scholar]
- Kurtenkov, A., Pessev, P., Tomov, T., et al. 2015, A&A, 578, L10 [NASA ADS] [CrossRef] [EDP Sciences] [Google Scholar]
- Lawlor, T. M. 2005, MNRAS, 361, 695 [NASA ADS] [CrossRef] [Google Scholar]
- Levesque, E. M., Massey, P., Olsen, K. A. G., et al. 2005, ApJ, 628, 973 [NASA ADS] [CrossRef] [Google Scholar]
- Martini, P., Wagner, R. M., Tomaney, A., et al. 1999, AJ, 118, 1034 [NASA ADS] [CrossRef] [Google Scholar]
- Mason, E., Diaz, M., Williams, R. E., Preston, G., & Bensby, T. 2010, A&A, 516, 108 [Google Scholar]
- Mayall, M. W. 1949, AJ, 54, 191 [NASA ADS] [CrossRef] [Google Scholar]
- McCollum, B., Laine, S., Vaisanen, P. et al. 2014, AJ, 147, 11 [NASA ADS] [CrossRef] [Google Scholar]
- Minniti, D., Lucas, P. W., Emerson, J. P., et al. 2010, New Astron., 15, 433 [NASA ADS] [CrossRef] [Google Scholar]
- Mould, J., Cohen, J., Graham, J. R., et al. 1990, ApJ, 353, L35 [NASA ADS] [CrossRef] [EDP Sciences] [Google Scholar]
- Munari, U., Henden, A., Kiyota, S., et al. 2002b, A&A, 389, L51 [NASA ADS] [CrossRef] [EDP Sciences] [Google Scholar]
- Nakano, S., Nishiyama, K., Kabashima, F., & Sakurai, Y. 2008, CBET, 1496 [Google Scholar]
- Nicholls, C. P., Melis, C., Soszyński, I., et al. 2013, MNRAS, 431, L33 [NASA ADS] [CrossRef] [Google Scholar]
- Ossenkopf, V., Henning, Th., & Mathis, J. S. 1992, A&A, 261, 567 [NASA ADS] [Google Scholar]
- Schmidt-Kaler, Th. 1982, Landolt-Börnstein: Numerical Data and Functional Relationships in Science and Technology, eds. K. Schaifers, & H. H. Voigt (Berlin: Springer-Verlag), VI/2b [Google Scholar]
- Shara, M. M., Moffat, A. F. J., & Webbink, R. F. 1985, ApJ, 294, 271 [NASA ADS] [CrossRef] [Google Scholar]
- Smith, N., Ganeshalingam, M., Chornock, R., et al. 2009, ApJ, 697, L49 [NASA ADS] [CrossRef] [Google Scholar]
- Soker, N., & Tylenda, R. 2003, ApJ, 582, L105 [NASA ADS] [CrossRef] [Google Scholar]
- Stȩpień, K. 2011, A&A, 531, A18 [NASA ADS] [CrossRef] [EDP Sciences] [Google Scholar]
- Telesco, C. M., Pina, R. K., Hanna, K. T., et al. 1998, Proc. SPIE, 3354, 534 [NASA ADS] [CrossRef] [Google Scholar]
- Tylenda, R. 2005, A&A, 436, 1009 [NASA ADS] [CrossRef] [EDP Sciences] [Google Scholar]
- Tylenda, R., & Soker, N. 2006, A&A, 451, 223 [NASA ADS] [CrossRef] [EDP Sciences] [Google Scholar]
- Tylenda, R., Crause, L. A., Górny, S. K., & Schmidt, M. R. 2005, A&A, 439, 651 [NASA ADS] [CrossRef] [EDP Sciences] [Google Scholar]
- Tylenda, R., Hajduk, M., Kamiński, T., et al. 2011a, A&A, 528, A114 [Google Scholar]
- Tylenda, R., Kamiński, T., Schmidt, M. Kurtev, R., & Tomov, T. 2011b, A&A, 532, A138 [NASA ADS] [CrossRef] [EDP Sciences] [Google Scholar]
- Tylenda, R., Kamiński, T., Udalski, A., et al. 2013, A&A, 555, A16 [NASA ADS] [CrossRef] [EDP Sciences] [Google Scholar]
- Tylenda, R., Górny, S. K., Kamiński, T., & Schmidt, M. 2015, A&A, 578, A75 [NASA ADS] [CrossRef] [EDP Sciences] [Google Scholar]
- Udalski, A. 2003, Acta Astron., 53, 291 [NASA ADS] [Google Scholar]
- Williams, S. C., Darnley, M. J., Bode, M. F., & Steele, I. A. 2015, ApJ, 805, L1 [Google Scholar]
All Tables
All Figures
|
Fig. 1 Example images of the field around V1309 Sco in the mid-IR and far-IR. The origin and wavelength of each image is given at the top of each panel. All images are in scale and show the same part of the sky. Contours shown in all images are drawn for the emission in the W1 band of WISE. East is left, north is up. |
| In the text | |
|
Fig. 2 Example images of the field around V1309 Sco at optical and near-IR wavelengths. All images are to scale and show the same part of the sky. The origin and wavelength of each image is given at the top of each panel. Contours in all images except that of W1, are shown for the optical emission in F673N. Contours in the WISE image correspond to the emission in the W1 band. East is left, north is up. |
| In the text | |
|
Fig. 3 XZ section of the dust shell geometry assumed in our modelling (Y axis is perpendicular to the figure). The shell of a thickness, ΔR, and a radius, Rs, is illuminated by a source in its centre. For α>αtrunc the shell is truncated, i.e. dust is present only within the full lines in the figure. The dust distribution is symmetrical in regard to the Z axis. The observer is in the XY plane. |
| In the text | |
|
Fig. 4 Model fits to the photometric measurements of the V1309 Sco progenitor in May 2007 (black symbols – see Table 4). Blue curves represent model A. Red curves represent model B. The parameters of the models are given in Table 3. Dotted curves represent the contributions from the star (maximum at shorter wavelengths) and the dusty envelope (maximum at longer wavelengths). Full curves represent the sum of the two components. |
| In the text | |
|
Fig. 5 Model spectrum compared to the photometric measurements of V1309 Sco in 2010 represented with the black symbols (see Table 5). Dashed and dotted blue curves show contributions of the central star and the two dust shells to the final model spectrum displayed with the full curve. Parameters of the model can be found in Table 3 (fourth column). |
| In the text | |
|
Fig. 6 Model spectrum compared to the photometric measurements of V1309 Sco in 2012 represented with the black symbols (see Table 6). Dashed and dotted blue curves show contributions of the central star and the dust shells to the final model spectrum displayed with the full curve. Parameters of the model can be found in Table 3 (fifth column). |
| In the text | |
|
Fig. 7 Luminosity of V1309 Sco plotted versus time in Julian dates. Full symbols indicate values derived in the present study. The asterisk indicates luminosity of the progenitor estimated in Tylenda et al. (2011a). Open symbols indicate luminosities during the eruption (big symbols) and decline (small symbols) derived in Tylenda et al. (2011a). See text for more explanations. |
| In the text | |
Current usage metrics show cumulative count of Article Views (full-text article views including HTML views, PDF and ePub downloads, according to the available data) and Abstracts Views on Vision4Press platform.
Data correspond to usage on the plateform after 2015. The current usage metrics is available 48-96 hours after online publication and is updated daily on week days.
Initial download of the metrics may take a while.