Fig. 4
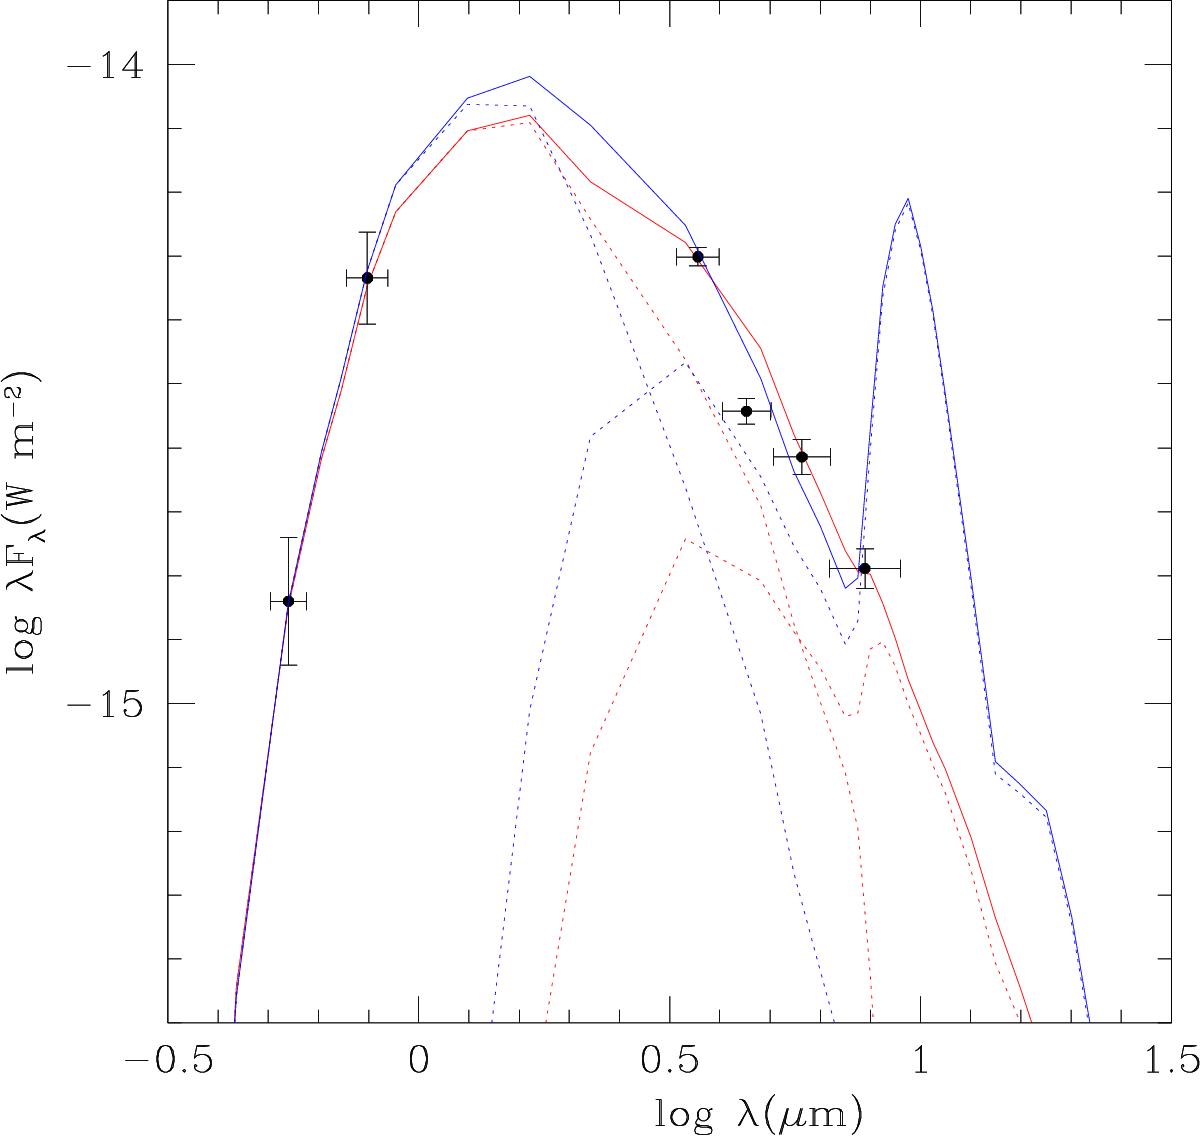
Model fits to the photometric measurements of the V1309 Sco progenitor in May 2007 (black symbols – see Table 4). Blue curves represent model A. Red curves represent model B. The parameters of the models are given in Table 3. Dotted curves represent the contributions from the star (maximum at shorter wavelengths) and the dusty envelope (maximum at longer wavelengths). Full curves represent the sum of the two components.
Current usage metrics show cumulative count of Article Views (full-text article views including HTML views, PDF and ePub downloads, according to the available data) and Abstracts Views on Vision4Press platform.
Data correspond to usage on the plateform after 2015. The current usage metrics is available 48-96 hours after online publication and is updated daily on week days.
Initial download of the metrics may take a while.