Free Access
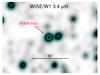
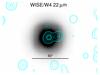
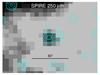
Fig. 1
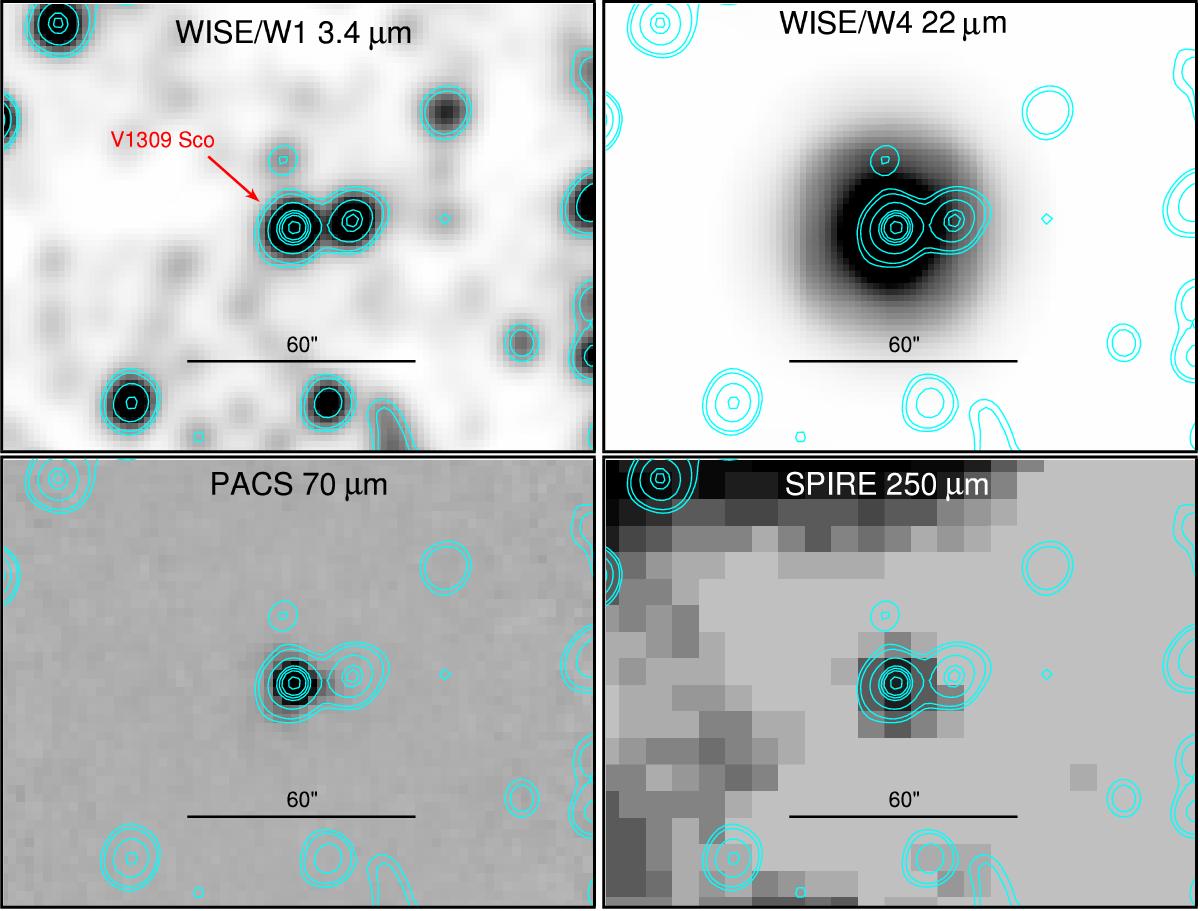
Example images of the field around V1309 Sco in the mid-IR and far-IR. The origin and wavelength of each image is given at the top of each panel. All images are in scale and show the same part of the sky. Contours shown in all images are drawn for the emission in the W1 band of WISE. East is left, north is up.
This figure is made of several images, please see below:
Current usage metrics show cumulative count of Article Views (full-text article views including HTML views, PDF and ePub downloads, according to the available data) and Abstracts Views on Vision4Press platform.
Data correspond to usage on the plateform after 2015. The current usage metrics is available 48-96 hours after online publication and is updated daily on week days.
Initial download of the metrics may take a while.