Fig. 6
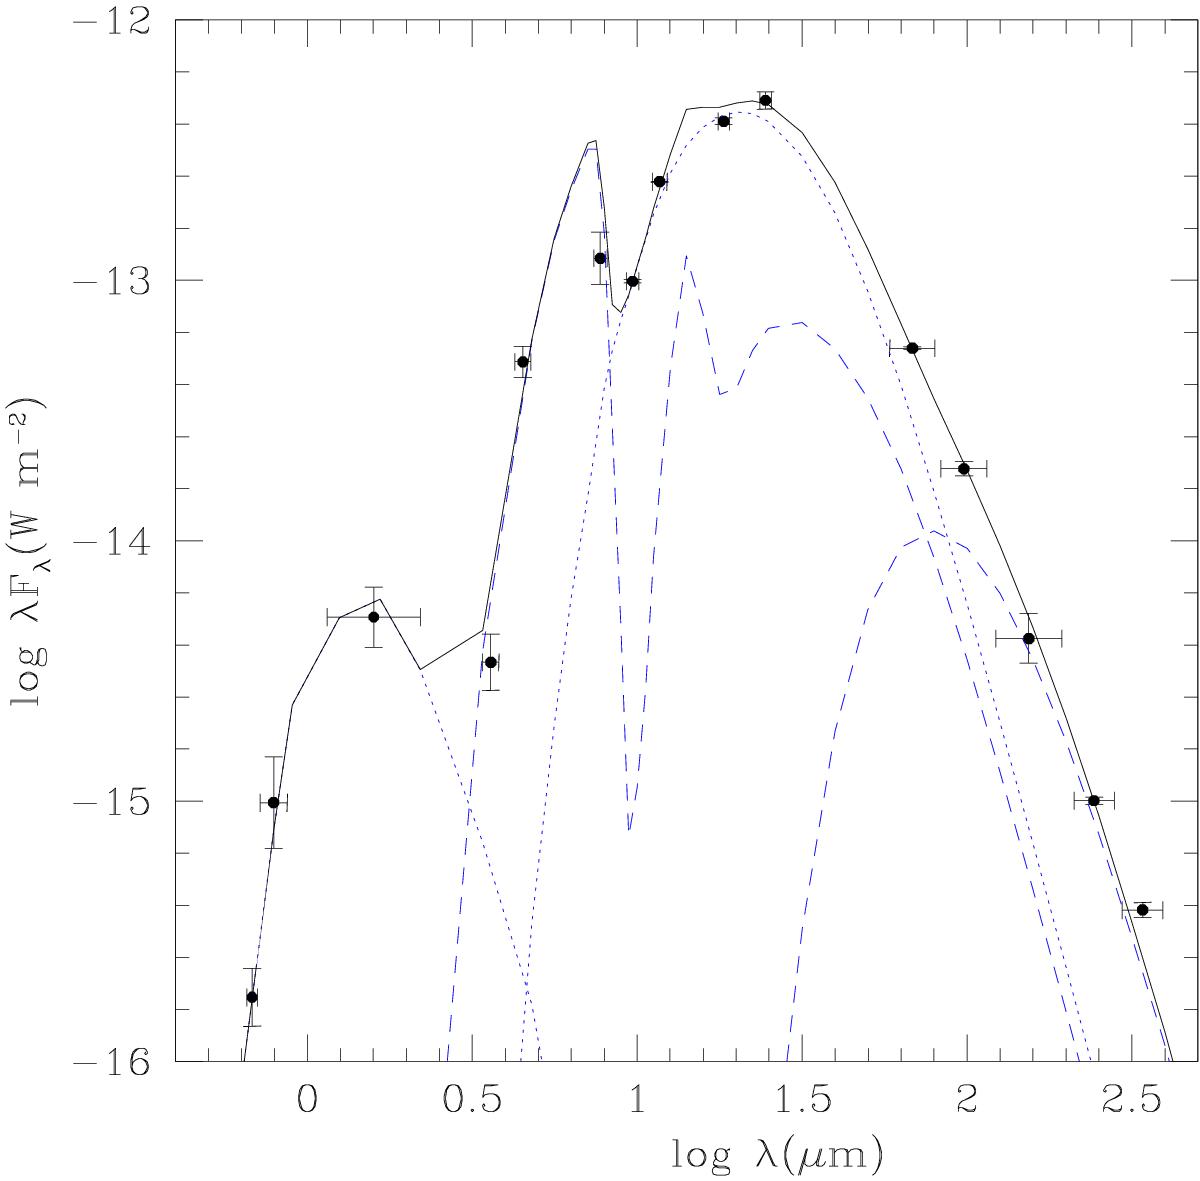
Model spectrum compared to the photometric measurements of V1309 Sco in 2012 represented with the black symbols (see Table 6). Dashed and dotted blue curves show contributions of the central star and the dust shells to the final model spectrum displayed with the full curve. Parameters of the model can be found in Table 3 (fifth column).
Current usage metrics show cumulative count of Article Views (full-text article views including HTML views, PDF and ePub downloads, according to the available data) and Abstracts Views on Vision4Press platform.
Data correspond to usage on the plateform after 2015. The current usage metrics is available 48-96 hours after online publication and is updated daily on week days.
Initial download of the metrics may take a while.