| Issue |
A&A
Volume 590, June 2016
|
|
|---|---|---|
| Article Number | A123 | |
| Number of page(s) | 16 | |
| Section | Stellar structure and evolution | |
| DOI | https://doi.org/10.1051/0004-6361/201527856 | |
| Published online | 26 May 2016 | |
The panchromatic spectroscopic evolution of the classical CO nova V339 Delphini (Nova Del 2013) until X-ray turnoff⋆,⋆⋆
1
Dipartimento di Fisica “Enrico Fermi”Università di Pisa,
56127
Pisa,
Italy
e-mail:
shore@df.unipi.it
2
INFN-Sezione Pisa, largo B. Pontecorvo 3,
56127
Pisa,
Italy
3
Osservatorio Astronomico (INAF) Tireste, via G.B. Tiepolo
11, 3413
Trieste,
Italy
4
American Astronomical Society, 2000 Florida Ave.,
NW, Suite 400, DC 20009-1231, USA
5
67 rue Jacques Daviel, 76100
Rouen,
France
6
Castanet Tolosan Observatory, 6 place Clemence Isaure, 31320
Castanet Tolosan,
France
7
Hamburger Sternwarte, Gojenbergsweg 112,
21029
Hamburg,
Germany
8
Department of Physics & Astronomy, University of
Leicester, University Road, LE1 7RH, UK
9
Instituut voor Sterrenkunde, KU Leuven, Celestijnenlaan
200D, 3001
Leuven,
Belgium
10
School of Earth and Space Exploration, Arizona State
University, PO Box
871404, Tempe,
AZ
85287-1404,
USA
11
Max-Planck-Institut fuer extraterrestrische Physik,
Giessenbachstraße 1,
85741
Garching,
Germany
12
Space Telescope Science Institute, 3700 San Martin Drive, Baltimore, MD
21218,
USA
13
Department of Astronomy, University of Minnesota,
116 Church Street S.E.,
Minneapolis, MN
55455,
USA
Received: 28 November 2015
Accepted: 17 February 2016
Context. Classical novae are the product of thermonuclear runaway-initiated explosions occurring on accreting white dwarfs.
Aims. V339 Del (Nova Delphinus 2013) was one of the brightest classical novae of the last hundred years. Spectroscopy and photometry are available from γ-rays through infrared at stages that have frequently not been observed well. The complete data set is intended to provide a benchmark for comparison with modeling and for understanding more sparsely monitored historical classical and recurrent novae. This paper is the first in the series of reports on the development of the nova. We report here on the early stages of the outburst, through the X-ray active stage.
Methods. A time sequence of optical, flux calibrated high resolution spectra was obtained with the Nordic Optical Telescope (NOT) using FIES simultaneously, or contemporaneously, with the Space Telescope Imaging Spectrograph (STIS) aboard the Hubble Space Telescope during the early stages of the outburst. These were supplemented with Mercator/HERMES optical spectra. High resolution IUE ultraviolet spectra of OS And 1986, taken during the Fe curtain phase, served as a template for the distance determination. We used standard plasma diagnostics (e.g., [O III] and [N II] line ratios, and the Hβ line flux) to constrain electron densities and temperatures of the ejecta. Using Monte Carlo modeling of the ejecta, we derived the structure, filling factor, and mass from comparisons of the optical and ultraviolet line profiles.
Results. We derive an extinction of E(B − V) = 0.23 ± 0.05 from the spectral energy distribution, the interstellar absorption, and H I emission lines. The distance, about 4−4.5 kpc, is in agreement with the inferred distance from near infrared interferometry. The maximum velocity was about 2500 km s-1, measured from the UV resonance and optical profiles. The ejecta showed considerable fine structure in all transitions, much of which persisted as emission knots. The line profiles were modeled using a bipolar conical structure for the ejecta within a relatively restricted range of parameters. For V339 Del, we find that an inclination to the line of sight of about 35°−55°, an opening angle of 60°−80°, and an inner radius ΔR/R(t) ≈ 0.3 based on vrad,max matches the permitted and intercombination lines. The filling factor is f ≈ 0.1, and the derived range in the ejecta mass is (2−3) × 10-5M⊙.
Key words: novae, cataclysmic variables / line: profiles / stars: individual: V339 Del (Nova Del 2013)
Coadded spectrum in fits format is only available at the CDS via anonymous ftp to cdsarc.u-strasbg.fr (130.79.128.5) or via http://cdsarc.u-strasbg.fr/viz-bin/qcat?J/A+A/590/A123
Based on observations made with the NASA/ESA Hubble Space Telescope, obtained (from the Data Archive) at the Space Telescope Science Institute, which is operated by the Association of Universities for Research in Astronomy, Inc., under NASA contract NAS 5-26555. These observations are associated with program # 13828.
© ESO, 2016
1. Introduction
Nova Del 2013, designated V339 Del, was discovered at unfiltered CCD magnitude 6.8 by Itagaki (AAN 2013) on 2915 Aug. 14.58 UT, and spectroscopic confirmation was provided shortly afterward (14.92 UT) by Masi (CBET 3628). The nova was discovered during its rising phase. Optical maximum was on Aug. 16.25 UT when it reached V ~ 4.3 mag (Munari et al. 2015). It rapidly became a popular target among amateurs (e.g., ARAS, AAVSO) and professional astronomers because of its brightness. It has been detected in the range γ-rays (Ackermann et al. 2014) through centimeter radio (ATel 5298, 5376). A study of the carbon spectrum in V339 del was published in Shore et al. (2014). A high resolution atlas of the first four months of the outburst, covering 3800−8800 Å, has been published by De Gennaro Aquino et al. (2015) and a discussion of the infrared development by Gehrz et al. (2015).
We are spectroscopically monitoring V339 Del at high resolution starting on Day 13 as part of the international campaign using coordinated optical (NOT/FIES) and UV (HST/STIS) observations. Our intent is to produce a benchmark data set of calibrated, high resolution panchromatic observations, covering the range from 1150−7400 Å, that would serve for modelers and as a baseline for comparison with less well covered historical classical and recurrent novae. By observing at specific epochs in the UV and optical bands, we sampled all the important resonance and excited state transitions of the key elements (especially H, He, C, N, O, and Ne) up through the four times ionized state. Our goal is to spectroscopically determine the density, velocity, and spatial distribution for different elements within the ejecta and how these properties change over time. We use these data to obtain information about the ejecta geometry, ionization structure, filling factor, and mass. Issues of chemical composition and homogeneity will be addressed in a future paper. In this first report, we present an analysis of the early decline and the X-ray supersoft source (SSS) plateau stage. The temporal development of the ejecta ionization and density structure, and comparisons with other recent novae similarly analyzed, are postponed to the next paper once our late nebular spectra have been taken.
In this paper, we check and extend the conclusions drawn from our earlier time development study of the recurrent nova T Pyx (Shore 2013; De Gennaro Aquino et al. 2014). T Pyx showed that the spectra arise in ballistically expanding, bipolar, highly fragmented ejecta. The velocity and density structures were modeled by simple radial power laws resulting from a ballistic expansion and there was no indication of a continuous outflow (i.e. winds) or multiple ejections. These structures were frozen in the expanding gas and evolved spectrally because of the changing illumination and continuum of the cooling white dwarf. Thus, the observed structures point back to the moment of origin during the thermonuclear runaway (TNR) and the advent of the explosion. We show in this paper that the same conclusions hold for a CO nova.
2. Observations and data reduction
Log of observations.
The data presented in this paper were primarily collected with HST/STIS (program 13388) and NOT/FIES (program 48-103). Table 1 gives the log of observations. The HST/STIS program consisted in a non-disruptive target of opportunity (ToO) for the early observation of bright Galactic novae. Each visit was just one orbit long. The instrument setup was chosen to cover the whole UV range from 1200 to 2900 Å. In addition, the choice of the echelle resolutions (E230H or E230M) was driven by the target magnitude, as was the aperture (0.2 × 0.2 arcsec in all cases), satisfying the requirements of high-spectral-resolution and instrument safety constraints. Each HST/STIS observation was triggered on the basis of the SWIFT UV magnitude obtained from UVOT and X-ray evolution complemented with the optical light curves, thus to cover the most important evolutionary phases of the ejecta. On 2014 Apr. 19 we also obtained HST/STIS low (G430L) and a medium (G430M) resolution spectra covering the wavelength ranges 2900−5700 Å and 3290−3560 Å, respectively. These were intended to cover spectral intervals not otherwise obtained with the echelle spectra and to provide an additional check on the flux calibration. The ground observations were activated in parallel to HST ToO and scheduled on the closest interval available for queue/service mode operations. Several NOT observations were taken as a stand-alone between combined STIS+NOT epochs and serve as a bridge between epochs.
The early decline of the nova was independently observed by Mercator/HERMES (R ≈ 86 000; see Raskin et al. 2011) which provided monitoring with an almost daily cadence during the first 100 days after discovery. Of these data we present a selection from the first 54 days of monitoring that span epochs not otherwise covered by our STIS+FIES programs and were useful for the kinematic analysis of the ejecta and its substructures along the line of sight during the optically thick phase.
HST/STIS spectra were reduced with the MAST online pipeline. The spectral orders where then merged with the IDL routine originally developed for GHRS by the HST team (CALHRS). The FIES spectra were preprocessed, extracted, and merged with the FIES pipeline. The spectra were subsequently flux calibrated with custom routines written in IDL and IRAF. We made sure that each FIES observation of the nova was accompanied by the observation of a spectrophotometric standard star, BD +28°4211, at similar airmass and pointing direction to minimize the color-dependent losses typical of fiber-fed spectrographs. We verified that the uncertainties in our flux calibration are at most 20% by comparison with photometric observations and lower resolution spectra (including from space). When necessary, the optical spectrum was offset in flux to match the level of the STIS UV spectrum. HERMES spectra were also preprocessed, extracted and merged by the instrument pipeline. However, they are not flux calibrated, since no spectrophotometric standard star was observed, and the spectrograph signatures (e.g., residual ripple) were not fully removed.
3. X-ray observations with Swift
We include a brief description of the nova’s X-ray development during our period of observation, since the central white dwarf is the photoionization source that drives the spectroscopic evolution of the ejecta in the optical and ultraviolet (cf. Woudt & Ribeiro 2014). Swift observations of V339 Del began on 2013 Aug. 14.96 UT. Starting at only nine hours after its discovery, the follow-up for V339 Del was one of the most rapid responses to a nova performed by Swift. Observations were obtained regularly until the nova entered the Sun constraint for Swift at 144.5 days after discovery. Data collection resumed on day 202.
A weak X-ray source was first detected by the X-ray Telescope (XRT; see Burrows et al. 2005) 35.6 days after the nova was discovered. The source then brightened by almost five orders of magnitude, passing through a period of large-amplitude flux variability before reaching a peak count rate of ~90 count s-1 (0.3−10 keV) around day 88. The X-ray source then remained bright, with a slow variation between ~80 and 20 count s-1, until the nova was too close to the Sun for observations. After re-emerging from the constrained zone, it was detected at about 1 count s-1. There followed a monotonic fading until observations ceased on day 373. Figure 1 shows the AAVSO V light curve (top panel), 0.3−10 keV X-ray light curve (middle panel), and the hardness ratio (HR), defined as the ratio of the counts in the 0.45−1.0 keV and 0.3−0.45 keV bands (bottom panel). The bright X-ray source was extremely soft, with very few counts being detected above 1 keV, hence our choice of energy bands.
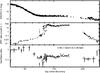 |
Fig. 1 Top: AAVSO visual light curve. Middle: Swift XRT count rate for the period covered by this paper, through Day 300. Bottom: Hardness ratio F(0.45−1 keV)/F(0.3−0.45 keV). The SSS phase is defined to be when the HR < 1. The first FIES/STIS epoch was before, and the second after the appearance of the SSS. |
4. Contemporary ultraviolet and optical spectroscopic development from Day 35 to Day 248
Our coordinated ground and HST/STIS high resolution spectroscopic observations cover three fundamental stages of the ejecta and white dwarf evolution: i) the iron-curtain (day +35 STIS spectrum with the bracketing FIES observations of day +25 and +46); ii) the transition phase (day +99 STIS and FIES spectra); and iii) the nebular phase after the peak of the X-ray super-soft source (SSS) phase. The nuclear source remained active on the white dwarf during this interval (the X-ray spectrum was still soft) but its luminosity was decreasing (day 243 FIES spectrum and day 248 STIS spectrum).
The optically thick stage (hereafter called the “Fe curtain”) is especially difficult to interpret in the UV since the complex overlapping bands of absorption lines from low ionization metallic species produces a strongly wavelength dependent pseudo-continuum. The spectral distribution also contains a number of “windows”, regions of reduced line opacity not associated with any strong transition but, instead, arising from photons escaping from the deeper, hotter parts of the ejecta (e.g., Hauschildt et al. 1992). The appearance (intensity, wavelength) of the pseudo-emission features depends on the velocity and density structure of the ejecta and the luminosity of the underlying white dwarf. The emission in any spectral interval depends on the velocity gradient, which for ballistic ejection is a constant that depends only on the maximum expansion velocity. In spectral regions where the optical depth is very large, and the radius of the effective photosphere is nearly that of the outermost material (e.g. far UV), there is no emission and virtually no flux. In contrast, in regions of lower opacity (near UV and optical), the volume filled by low optical depth gas is proportionally higher, and emission lines may occur. This is illustrated by the first STIS spectrum of V339 Del. Shortward of 2000 Å, there were few genuine emission lines, the O I 1302, 1304 Å and C II 1334, 1335 Å doublets being likely exceptions (Fig. A.1). Longward, several emission lines, notably N II 2143 Å, C II 2423 Å and Mg II 2796, 2803 Å were clearly present (Fig. A.1). No other absorption feature can be identified at this stage with any certainty since the line formation is highly stratified and depends on the detailed coupling of individual transitions that overlap and shadow each other (see, e.g. Hauschildt et al. 2002; Shore 2012).
The optical range (NOT/FIES spectra from day 13, 24 and 46, and Mercator/HERMES spectra from day 2 to day 45), having lower optical depth than the UV, was characterized by numerous emission lines from Fe II and low ionization-energy ions (Fig. A.1). At this time, we observed distinct velocity ranges of the absorption components and a characteristic emission component common to all transitions of similarly small optical depth. The HERMES spectral sequence in Fig. 2 shows that during the first five days after discovery the lines were dominated by P Cyg-like profiles, with the absorption trough extending to high velocities: −1500 km s-1 (Hγ), −1600 km s-1 (FeII and CaII). The NaI D lines did not appear until day 3, and its absorption trough never extended beyond −1000 km s-1. Short lived (day 2 to 5) low velocity absorptions were also observed in CI and OI1, for which we measure vrad ~ −500 and −1000 km s-1, respectively (see Fig. 2). At this early stage, the absorption troughs were featureless and unsaturated.
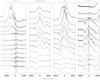 |
Fig. 2 Line profile evolution of the transitions NaI D, Fe II 5169 Å, Hγ, and Ca II K in the early decline (day +2 to day +54) HERMES spectra. In each panel time increases from bottom to top. The epoch of each spectrum being on the left side of the figure. The y axis unit (ADU) have been omitted since the spectra are not flux calibrated and the spectral signatures have not been properly removed. However, day 2 transitions are plotted as in the original spectrum with the 0 counts level matching the x axis. The subsequent epochs have been offset by 0.75 ADUs in the case of the NaI D, 0.70 ADUs in the case of the Fe II 5169 Å transition, 0.85 ADUs in the case of Hγ and 3.5 ADUs in the case of the CaII K transition. |
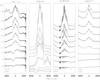 |
Fig. 3 Line profile evolution of neutral C and O during the early decline monitored at Mercator/HERMES. The C I 7713 Å, [O I] 5577 Å, and [O I] 6300 Å lines are offset with respect to each other by 0.8, 0.75 and 0.75, respectively. The first 5 spectra of OI 8446 Å were offset by 0.5 while the last four were scaled to 0.25 and offset by 1.33 × n, with n being the spectrum position in the sequence. The “0.5, 0.75” and “0.4−0.6” tick-marks indicate the scale in those panels whose x-axis is not matching the 0 ADU level of the y-axis. |
From day 11 the absorption trough fragmented into narrow substructures, while the maximum radial velocity of the ensemble of absorption components reduced to ~–1350 to −1400 km s-1 for FeII and CaII and H (the bulk of the absorption being centered at ~–1000 km s-1). The NaI D lines remained at lower velocity, centered at ~−900 km s-1. By the time the absorption substructures disappeared (at end of the Fe curtain, day 54), the emission lines had developed broad wings that were at least as extended as the maximum velocity of the absorptions components of the day 2 and day 3 spectra (H and Fe). The hydrogen absorption troughs followed the velocity decrement caused by the decreasing optical depth along the line series. The maximum negative velocity was, however, the same across the whole Balmer series and reached about −1300 to −1400 km s-1 (Fig. 4).
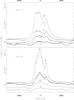 |
Fig. 4 Line profile of the hydrogen Balmer lines Hβ, Hγ, Hδ, Hζ at day +14 (top panel) and +25 (bottom panel) in the NOT/FIES spectra. The spectra were flux calibrated and the Hγ, Hδ, Hζ lines have been offset with respect to Hβ by the constants −0.5e-11, −1e-11 and −1.5e-11, respectively, in the +14 days spectrum and by the constants −0.75e-11, −1.5e-11 and −2.25e-11, again respectively, in the +25 days spectrum. Note the Balmer progression in the absorption trough: decreasing strength and velocity of the feature and increasingly fragmented structure with increasing series number. |
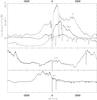 |
Fig. 5 Comparison of the line profiles of the UV resonant lines (MgII 2800 Å, CII 1334 Å, and OI 1302 Å) from day 99 with the optical ones NaI D and CaII K (CaII H, in the figure, is blended with Hε). The NaI D had almost disappeared and was blended with He I 5876 Å emission which was the strongest line in the 5800−6000 Å range by this time. |
The P Cyg emission components, when present, were featureless as were the absorptions (see Figs. 2 and 3). The emission lines grew progressively stronger and more complex with time. The hydrogen Balmer and neutral O permitted lines were initially flat-topped, caused by the high line optical depth (day >5 to 16) and, later, both developed a more “peaked” profile (Figs. 2−4). The profiles were soon alike for all lines, with a distinct emission peak at about +600 km s-1, although with no corresponding component at −600 km s-1, and displaying a substantial, complex emission in the velocity interval |vrad| < 500 km s-1. This profile asymmetry can only in part be attributed to an opacity effect (for example, Fig. 4), since it was also present on the forbidden transitions [O I ] 5577, 6300 Å (Fig. 3).
The intensity of the Fe II emission began decreasing around day 33, when the He I emission lines (e.g., 5876 Å and 7065 Å) first appeared. We take this as a signature that the UV Fe curtain had started its gradual lifting and that the ejecta were patchy. At UV wavelengths, our first HST/STIS observation (day 35) displayed a still heavily veiled continuum, although resonance lines, such as Mg II 2800 Å, O I 1302 Å, and C II 1334, 1335 Å were visible (Figs. A.1 and 5). We do not observe absorption components except for the Mg II doublet and the redder component of the O I doublet. What appears to be an absorption trough of the C II doublet, extending to −2500 km s-1, is probably spurious, since the blue wing of the emission remains the same during the subsequent epochs.
The day 99 combined UV and optical spectrum was marked by signatures of the so-called “transition phase”: the appearance of He II 1640 Å and 4686 Å emission and the nebular transitions [O III] 4959, 5007 Å and 4363 Å together with their isoelectronic counterparts [N II] 6584, 6548 Å and 5755 Å. This also coincided with the start of the supersoft source (SSS) stage. A comparison of some of the resonance line profiles from the UV and optical is shown in Fig. 5. The ionization level of the transitions in the UV range had significantly increased as shown by the presence of the N IV] 1486 Å, NV 1238, 1242 Å and C III] 1909 Å, C IV1548,1550 Å (Fig. A.2). The He II 4686 Å and the [O III] and [N II] nebular lines were already present in our day 73 NOT/FIES spectrum, implying by the higher ionization and photo-excitation that the SSS phase had already begun. This agrees with the X-ray light curve and hardness ratio variation. The main difference between the two optical spectra, other than the overall weakening in flux because of the expansion of the ejecta, was that the asymmetry of the Balmer and forbidden line profiles decreased from day 73 to 99. The asymmetry consisted of a pronounced blue peak at vrad ≈ −900 km s-1 substantially broadening the line profile observed during early decline. On the red side of the profile, the lines appeared unchanged with respect to the early decline, and the peak at around +600 km s-1 (Fig. 6) was still visible.
With the ingress to the transition phase, [O I] 5577 Å, among the oxygen lines, showed the largest change (see Fig. 7). While the [O I] 6300 Å line profile remained invariant, 5577 Å almost vanished. Although residual emission was still present on 5577 Å at −680 and +170 km s-1, the central emission peak of the profile was absent. The two lines have different origins: [O I] 6300 Å can be collisionally excited directly from the ground state. It is also fed by the 1641 Å line, whose upper state is populated by absorption in the 1304 Å resonance transition. In contrast, 5577 Å is fed from the intercombination 2324 Å transition and has a much lower branching ratio from the 33S state than 1641 Å (see Fig. 1 in Shore & Wahlgren 2010). By Day 99, we know that O I 1304 Å emission was extremely weak and O° was a minor species, but the O I 1025 Å line could also be pumped by Lyβ throughout the ejecta, leading to 6300 Å emission. This may explain the puzzling persistence of the neutral oxygen forbidden emission during the transition and early nebular stage without needing to invoke extremely opaque knots within the ejecta.
We have only a NOT/FIES spectrum for day 122, but we mention it here since this was the last obtained before the source was solar constrained from the ground (Fig. 7). Relative to Day 99, although small changes were observed in individual features, the lines merely decreased in intensity.
On Day 248, the combined UV and optical spectrum (Fig. A.3) was similar to that on the day 99 for both observed ionization stages and transitions and species. The lines just decreased in flux as the gas expands. Since the profile fine structure may be produced by density differences among the individual knots, we note that there were only small differential changes between the two dates (Fig. 9). We can use this to address a simple question: do the substructures follow the overall density decrease of the ejecta with time (t-3). From the persistence of the knots and their relative visibilities during the late stages, it seems the answer is “yes”. The knots are the “tip if the iceberg”, the largest fluctuations in the density distribution of the fragments. Their densities change along with the rest of the gas (see Sect. 5.4). The substructures appear to be density enhancements that are otherwise stationary with respect to the diffuse gas of the ejecta.
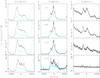 |
Fig. 6 O I and O III evolution from the NOT sequence. Left: [O III] 5007 Å (black), 4959 Å (blue); middle: [O I] 6300 Å (black), 6364 Å (blue); right: [O I] 5577 Å. |
5. Discussion
This panchromatic series of spectra provides a survey of the ionization structure and its variation with time. Four ionization stages were available for C (C°–C+3) (C I profiles from the earliest spectra are presented in Shore et al. (2014) and de Gennaro Aquino et al. (2015) and N (N+–N+4) during the epochs of simultaneous FIES and STIS coverage. This spectral development is shown in Figs. 8. During the opaque phase (day 35 STIS spectrum) only C II was visible with a featureless emission component against which interstellar and Fe curtain absorption components can be distinguished. The C III] and C IV lines were not detected. The complex ensemble of features visible in the velocity range −3000 to +3000 km s-1 around each of them was entirely caused by the metallic absorption bands. Similarly only [N II] 5755 Å, in the optical, appeared in emission. Lacking simultaneous calibrated optical spectra from the NOT, we show in Fig. 8 the spectra from Days 25 and 46 that flank the STIS epoch. The profile was weaker and blended on day 25 but by day 46 had fully developed the same profile as the [O I] 6300 Å and related lines. The higher ionization stages of N at this time were not observed in the UV and completely dominated by strong metallic absorption lines. It is possible, however, that emission was already beginning to develop in the N III] 1750 Å and N IV] 1486 Å lines.
On day 99, during the transition stage, strong emission on three carbon (C+–C+3) and four nitrogen (N+ −N+4) ions were visible. The profiles were very asymmetric, with the blueshifted peak at ~–800 km s-1 dominating the line profiles, and with little or no redshifted counterpart. The +800 km s-1 peak was accentuated in the N IV] and N V lines, the red to blue component ratio increasing with ionization stage. The emission wings were nearly identical in the ions of both species, extending to −1500 to −1800 km s-1. In addition, they displayed fine structure (better visible in [NII] and CIII]), with individual peaks of width ~200 km s-1 and distributed throughout the velocity range −1000 ≤ v ≤ 1000 km s-1. None coincided with the velocities observed during the Fe curtain stage, and the peak at +600 km s-1 observed during the opaque stage had disappeared or was blended with similar, lower velocity structures. The N IV] and C III] (isoelectronic) profiles were not quite identical, the emission in the interval −500 to 500 km s-1 was stronger for C III] than N IV], but the red to blue peak ratio was about the same.
Our day 248 (UV) and 243 (optical) spectra again showed similar line profiles in term of substructures in the velocity space, but with significantly changed relative intensities. The blue peak at ~−800 to −900 km s-1 faded faster than any other substructure within the line profile, contrarily to the peak at +600 km s-1 which faded at a slower pace (Fig. 9).
5.1. Extinction
The extremely rich interstellar absorption spectrum toward V339 Del will be treated in a separate paper. We have, however, derived independent extinction constraints based on comparing the optical and ultraviolet line profiles to the LAB 21 cm H I profile (Kalberla et al. 2005) in the velocity range −100 ≤ vLSR (km s-1) ≤ 100. We show (Fig. 10) the comparison of the 21 cm line with tracers of the neutral gas, O I 1304 Å (day 28) and NaI D (Day 99). In the velocity range covered by both lines, the integrated neutral hydrogen column density, NH was ~1.1 × 1021 cm-2. This is consistent with the minimum H I absorption derived from the Swift spectra obtained during the SSS phase. The extinction derived from the this NH is E(B − V) ≈ 0.17 (Güver & Özel 2009), although we cannot correct for the molecular fraction so this refers to only the atomic component. The value is consistent with that reported by Munari et al. (2015), E(B − V) = 0.18, based on optical spectral calibrators.
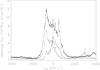 |
Fig. 7 Day 122, for which only optical observations were obtained. Comparison of the Hβ (solid), [N II] 5755 Å (dash), and [O I] 6300 Å (dot-dash) line profiles. No scaling has been applied. Note the change in the relative strength of the individual emission features with ionization stage. |
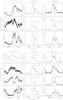 |
Fig. 8 Line profile of the C II–IV and N II–V resonant transition at the various epoch for which we have contemporaneous optical and UV observations. See text for more details. |
5.2. Distance and luminosity
Notably among recent novae, near infrared interferometric observations were obtained with CHARA (Schaefer et al. 2014) almost immediately after discovery. These showed an increase in the angular size of the ejecta from day +1 (from the estimated outburst onset) to day 27, from which Schaefer et al. determined a distance of 4.54 ± 0.59 pc. They assumed an expansion velocity of 650 km s-1, based on the Si II 6347, 6371 Å doublet. Since these are intrinsically weaker lines than the Balmer or any of the usual optically thick tracers of the ejecta, they form closest to the same pseudo-photosphere that produces both the optical and infrared continuum during the earliest stages of the expansion.
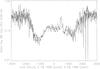 |
Fig. 9 Ratio of the C III] 1909 Å flux on day 99 over day 248 flux (solid line) and same for the N IV] 1486 Å (dashed line). Note the strong decrease in the strength of the +600 km s-1 feature and the near identity of the variation for the two lines. In both cases, the weaker component of the doublet is negligible. |
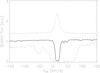 |
Fig. 10 Interstellar line profiles for O I 1303 Å (dot-dash) and Na I D1 (solid) compared with the LAB 21 cm H I profile (dash) in LSR velocity. The O I profile is from the Day 99 STIS spectrum, that for Na I D1 is from the Day 14 FIES spectrum. |
To obtain independent values for the extinction and distance, we used a template nova, the classical CO nova OS And 1986. Our method was as follows. OS And was observed with IUE at high resolution (R ≈ 10 000) during the Fe curtain stage, from day 4 to day 22 after discovery, after which observations were interrupted by the outburst of SN 1987A (Schwarz et al. 1997). This was the only bright CO nova observed in the ultraviolet at a stage comparable to that of the first NOT/STIS sequence. We compared our day 35 STIS spectra with high resolution IUE spectra of OS And obtained between day 12 (LWP 9717, 9719) and day 22 (SWP 29981) after optical discovery (1986 Dec. 17 and Dec. 27 respectively) using E(B − V) = 0.18 for V339 Del and the extinction for OS And obtained by Schwarz et al. (1997), E(B − V) = 0.25 ± 0.05. This provided a close match, with the flux for V339 Del being about 1.6 ± 0.1 times higher than OS And (1200−1900 Å). The long wavelength IUE exposures were slightly earlier and at this stage that can make a difference, but they were similar. The comparison is shown in Fig. 11. The Fe curtain features correspond well after scaling, especially near 1750 Å, the part of the extinction curve that is nearly flat. Thus, for a distance of OS And of 5.1 ± 1.5 kpc (Schwarz et al. 1997), the derived distance to V339 Del is about 4.1 kpc. This is consistent with the CHARA near infrared interferometric determination.
During the Fe curtain phase, before the detection of soft X-rays, the high optical depth of the ejecta insures that the irradiation from the central source is completely reprocessed into the visible and ultraviolet. Gehrz et al. (2015) have published near infrared (JHK) photometry that is contemporaneous with the NOT/STIS observations during the first 100 days Since we do not have simultaneous infrared fluxes, any bolometric luminosity estimate is a lower limit but, given the continuum, it is likely that only a small fraction of the flux is missing. The 1200−7400 Å luminosity was Lbol ≥ (5 ± 0.5) × 104L⊙. Even as a lower limit, this is at or above the Eddington luminosity for a Chandrasekhar mass white dwarf. Since, as we have argued, the ejecta were neither spherical nor completely covering, this estimated luminosity is an even more restrictive lower bound. Note that this Lbol does not refer to the maximum luminosity during the explosion, but to the state of the WD long after the ejecta were in free expansion.
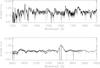 |
Fig. 11 Comparison of V339 Del (solid, E(B − V) = 0.18 and divided by 1.6) and OS And 1986 (dot, E(B − V) = 0.25) for Day 38. The fluxes of each are scaled by 10-10 erg s-1 cm-2 Å-1. See text for discussion. |
5.3. Geometry
To obtain a picture of the geometry of the ejecta, since the solid angle is needed for obtaining its mass, we used Monte Carlo modeling, as in our recent papers on T Pyx (De Gennaro Aquino et al. 2014), V959 Mon (Shore et al. 2013), and our companion study of V339 Del (Shore et al. 2014). Assuming a constant mass for the ejecta and an inverse cubic radial dependence for the density obtained from a linear velocity law, we set the maximum expansion velocity to 2500 km s-1, guided by the highest velocities observed on the UV resonance lines and the optical Balmer lines, and explored a range of inclinations (i), ejecta opening angles (θo, the outer angle and θi, the inner angle), and fractional inner radius, ΔR. The ionization was not explicitly modeled from first principles, but a comparison was made between the individual line profiles for different ions and a range of models. We show sample results for the low and high ionization stage lines compared with the observed profiles in Fig. 12. The asymmetries in the profile are yet to be understood, but the emission lines in all novae display them when they are optically thin.
With the inner angle fixed at 90° and vmax = 2500 km s-1, the range of allowable parameters is 35° ≤ i ≤ 55°, 10° ≤ θi ≤ 30° and ΔR/R ≈ 0.3. As shown in Fig. 12, the profiles are reproduced by the bipolar geometry. Individual features are, however, random (this procedure is based on a Monte Carlo simulation), so even the relatively large dissimilarities in the peaks can be explained as chance asymmetries of the ejecta. The essential feature of the profiles is that they require a bipolar structure and that the peaks are merely projection effects. Regarding the geometry, with higher quality spectra covering longer times, it is now emerging that the non-spherical structure – that is roughly bipolar – is generic (see also Woudt et al. 2009). This has been emphasized by Shore (2013, 2014), and Ribeiro et al. (2013a,b, 2014). The ejecta are, however, not really axisymmetric. Although asymmetries have been noted for some time, they are based on early spectra when it could be attributed to optical depth effects (see, e.g., Shore 2012). In our case, the profiles are optically thin and the asymmetries are intrinsic. The analysis presented here shows that the ejecta are far from ideal structures, and the substructures seem to have a random distribution.
The different ionization stages can be reproduced with the bipolar ejecta with a single parameter change, the outer cone angle. Keeping all other parameters fixed, the profiles of the higher ions require a narrower region of line formation (for N II] as for the other lower ionization stages the outer angle was 10−20° while for the higher ions it was closer to 30−40°.
5.4. Electron density
The [O III] 4363, 4959, 5007 Å lines were used to estimate the electron density in the velocity interval of highest S/N ratio, in the range from −1000 to 1000 km s-1, for four epochs (days 99, 122, 243, and 435) for which we have calibrated NOT spectra and when the ejecta displayed the nebular lines. It was never possible to perform a similar analysis for the [N II] lines because, during this epoch, the 6548, 6583 Å doublet was always too severely blended with Hα. The adopted reddening was E(B − V) = 0.18 (Munari et al. 2015) and we assumed an electron temperature of 104 K. The latter does not critically affect the result (Osterbrock & Ferland 2005). Two related properties result from the analysis. For ballistic ejecta, the electron density varies as ne ~ r-3, and the radial position is exchangeable with the radial velocity once the matter is transparent (i.e. the velocity is linearly dependent on radius). Thus, regardless of the symmetry of the ejecta, the same electron density applies to any transition within the same velocity interval. The Hβ line was used to decompose the blend between Hγ and [O III] 4363 Å, after having confirmed that the line profile for the Balmer lines was the same as the other optically thin transitions. For the first observation, day 99, this is not certain since there was some residual self-absorption for the hydrogen transitions. But thereafter, the hydrogen and [O III] (and [N II] 5755 Å) profiles agree in detail. The narrow emission features have widths of order 50−100 km s-1, except for the strongest at ±550 km s-1 that are of order 200 km s-1, and the wings extend to ±1500 km s-1.
The ratio [ F4959 + F5007 ] (Δvrad,t) /F4363(Δvrad,t) then provides the ne(t). This result is shown in Fig. 13 and listed in Table 2. The uncertainties in ne were derived from the noise in the intensity ratio within the specified velocity interval. For comparison, we also plot the expected temporal variation in the density, ne ~ t-3; a least squares fit to a power law gave the exponent −2.4, including the marginally nebular spectrum from day 99. An additional check that the ejecta were in the nebular stage is that F(5007)/F(4959) ≈ 3; this was found at every point in the line profile after day 99. As a comparison, in Fig. 13 we also show the time dependent Hβ fluxes. Since the Balmer lines are formed by recombination once the ejecta turn transparent in the UV, Hβ should display the same variation as the independently determined ne; the line in Fig. 13 is the t-3 variation. Sample fluxes are given in Table 3 (a more complete analysis will be presented along with the abundances in the next paper in this series).
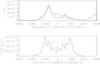 |
Fig. 12 Sample model profiles for the Day 99 spectra. Top: N IV] 1486 Å (solid), He II 1640 Å (dot). Bottom: model profiles (flux in arbitrary units). The model parameters are listed for the two simulations. DA RIFARE. |
The derived physical properties.
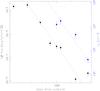 |
Fig. 13 Hβ flux (black) and electron density time dependence. The Hβ integrated flux has been measured from the full set of NOT/FIES spectra. The electron density has been obtained from the [O III] analysis, as described in the text only for the NOT/FIES spectra in nebular conditions. The error bars are 1σ errors. The two dotted lines indicate the t-3 dependence and are not a fit to the data points. |
The X-ray source was active during most of the interval described in this paper. Hence we expect that the radiative balance in the optically thin ejecta were still governed by photoionization processes. The densities were not yet so low that the ejecta had reached the frozen-in state, which occurred after Day 248 (see, e.g., Shore 2012, for discussion). We will discuss this stage in a future paper.
5.5. Filling factor and mass
The filling factor, f, was computed using the (integrated) Hβ luminosity from each NOT spectrum and ne obtained from the [O III] analysis, following the method described in Shore et al. (2012). One difference here is the number of optical spectra obtained during the later stages of the expansion, when the ejecta were optically thin. It was, therefore, possible to see if f varied with time. The overall ejecta geometry was obtained from the model line profiles. The ejecta were optically thin in the Lyman transitions. The results for f are shown in Fig. 14, together with the derived ejecta mass, and listed in Table 2. The filling factor and mass were roughly constant after Day 99, f ≈ 0.07−0.2 and Mej ≈ (2−3) × 10-5M⊙. The [N II] 6548, 6583 Å doublet remained too blended with Hα during the period discussed here for an independent determination of ne. As with the electron density, the ejecta were still in the transition to nebular on Day 99, during which time the Lyman series was still optically thick, hence the overestimate of the filling factor on that date. The contrast between the diffuse gas and the filaments was, however, reduced in the still relatively compact ejecta, and became more distinct in the later spectra.
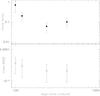 |
Fig. 14 Time dependence of the inferred filling factor and ejecta mass. Error bars are 1σ. See text for discussion. |
The derived mass, and filling factor for V339 Del are similar to the other recently observed classical nova, V959 Mon (Shore et al. 2013) but higher (for both) than T Pyx by the same analysis (Shore et al. 2014). That the filling factors are relatively small also supports the idea that there is a physical variance in the line profiles that is well-captured by the Monte Carlo modeling. The mass is in line with predictions of TNR modelling (see, e.g., Starrfield et al. 2012). The higher masses previously reported in analysis of classical novae have not included this information and, as noted in Shore (2013) and Shore et al. (2014), have likely systematically over-estimated the ejecta masses.
Sample line integrated flux from NOT/FIES set of spectra.
6. Conclusions
In its basic properties, V339 Del is not remarkable for a CO nova. For the quantity, quality and timing of the multiwavelength observations, and the enormous spectroscopic archive amassed, however, it surpasses even the optical spectroscopic database for the classical nova DQ Her (Stratton & Manning 1939; Payne-Gaposchkin 1957). Our aim was to systematically sample the range of spectroscopic diagnostics at critical stages during the evolution of the outburst. By combining X-ray, ultraviolet, and optical spectroscopy and spectrophotometry, we have obtained a set of benchmark parameters for this nova.
Abundances for key elements were not derived at this stage. We intend to perform a complete analysis once the SSS phase has definitively ended and the ejecta are in freeze-out (e.g., Vanlandingham et al. 2001). The geometry and relatively low filling factor of the expanding matter, and the requirement to treat time dependent excitation and ionization balances because of the wide range in densities, makes a photoionization analysis too preliminary at this time. The next paper in the series will address this question. The HST/STIS observations indicate that there was no substantial Ne overabundance. In all spectra following the nebular phase transition, neither [Ne IV] 1602 Å nor [Ne V] 1575 Å were detected above the noise and were an order of magnitude weaker than any of the previously studied ONe novae (reported in De Gennaro Aquino et al. 2014). The prominence of the C and N lines throughout the optically thick stage, including the infrared (ATel 5336, 5337), point to the overabundances of the light elements. It should be noted that no CO detections were reported during the early expansion.
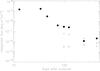 |
Fig. 15 Flux variations for select lines from the NOT sequence. Dot: Hβ, plus: He II 4686 Å; diamond: [Fe VII] 6087 Å. |
Our main conclusions are:
-
The maximum expansion velocity was ~2500 km s-1 measured from the emission line wings. During the early Fe curtain stage, all transitions that were strongly coupled to ultraviolet resonance and low lying states displayed P Cyg absorption troughs whose profiles were consistent with ejecta of fixed mass in ballistic expansion. Specifically, the velocity field was consistent with a linear radial expansion law and there was no evidence of secondary ejections or changes in the maximum velocity of the lines over time. There was no evidence for a wind during the later stages of the outburst, and there is no indication of one during the Fe curtain phase.
-
The ejecta were represented by a global biconical geometry. There were, however, distinct asymmetries between the lobes that persisted and became more distinct as the higher velocity matter turned transparent. The explosion, as now appears to be a more general result, was not axisymmetric. Individual knots were present that span several hundreds of km s-1 and correspond to tens of percent of the radial extent of the ejecta for ballistic expansion. The ejecta were highly fragmented over a large range of velocity scales (hence radial sizes) but organized in a comparatively small number of distinct structures seen during the P Cyg absorption stage. The emission line profiles all displayed extremely narrow structures, which was duplicated in virtually all ionization stages.
-
During the Fe curtain maximum, the luminosity in the 1150−7500 Å band – that should contain the bulk of the emission – was at least 5 × 10⁴L⊙. In light of the conclusions about the ejecta geometry, the actual luminosity at peak could have been significantly higher. To date, the bolometrically most luminous CO nova was LMC 1991, which was measured above 105L⊙, and V339 Del might have reached similar values (depending on the flux fraction lost from our line of sight).
-
A distance of ~4.2 kpc was obtained using a comparison with IUE high resolution spectrophotometry of the CO nova OS And 1986. The extinction was derived from the Lyα profile and from comparisons between the velocity extent of the optical Na I D and UV interstellar resonance lines and the 21 cm LAB spectrum along the line of sight. The derived value was 0.2 ± 0.04, consistent with published values based on early optical observations. This implies a minimum neutral hydrogen column density of 1.2 × 1021 cm-2 that is consistent with the last fit value from Swift X-ray spectrophotometry during the late SSS phase.
-
The recombination-dominated transitions, such as He II 1640 Å, 4686 Å, and the Balmer lines, followed the same temporal trend as the electron density, varying as t-3 during the nebular stages.
-
The filling factor was between 0.1 and 0.3. The ejecta were consistent with chemical homogeneity, but this conclusion is tentative pending a full abundance analysis.
-
The derived mass of the ejecta was (2−3) × 10-5M⊙.
Our program of observations is continuing into the late nebular stage and will be treated in the next paper in this series.
Acknowledgments
Based on observations made with the Nordic Optical Telescope, operated by the Nordic Optical Telescope Scientific Association at the Observatorio del Roque de los Muchachos, La Palma, Spain, of the Instituto de Astrofisica de Canarias. The research leading to these results has received funding from the European Union Seventh Framework Programme (FP7/2007-2013) under grant agreement No. 312430 (OPTICON). Sumner Starrfield acknowledges partial support from NASA and NSF grants to ASU. C.E.W. acknowledges partial support from NASA Swift grant NNX14AC54G. Simone Scaringi acknowledges funding from the Alexander von Humboldt Foundation.
Based on observations made with the NASA/ESA Hubble Space Telescope, obtained [from the Data Archive] at the Space Telescope Science Institute, which is operated by the Association of Universities for Research in Astronomy, Inc., under NASA contract NAS 5-26555. These observations are associated with program # 13828. Support for program #13828 was provided by NASA through a grant from the Space Telescope Science Institute, which is operated by the Association of Universities for Research in Astronomy, Inc., under NASA contract NAS 5-26555.
We thank our collaborators in the ARAS group for their remarkable diligence, skill, and persistence in obtaining spectroscopy of this and other novae and for the resulting archival treasures. The program described here was planned during a workshop in Pisa in July 2013, fortuitously just before the announcement of V339 Del, and we thank the participants or their insights, especially A. Caleo, C.-C. Cheung, J. José, J.-U. Ness, and B. Warner. We also thank D. Gies, P. Hauschildt, D. Korcakova, P. Kuin, P. Selvelli, F. Walter, and P. Woudt for discussions and exchanges.
References
- Ackermann, M., Ajello, M., Albert, A., et al. 2014, Science, 345, 554 [NASA ADS] [CrossRef] [Google Scholar]
- Burrows, D. N., Hill, J. E., Nousek, J. A., et al. 2005, Space Sci. Rev., 120, 165 [NASA ADS] [CrossRef] [Google Scholar]
- De Gennaro Aquino, I., Shore, S. N., Schwarz, G. J., et al. 2014, A&A, 562, A28 [NASA ADS] [CrossRef] [EDP Sciences] [Google Scholar]
- De Gennaro Aquino, I., Schröder, K.-P., Mittag, M., Wolter, U., et al. 2015, A&A, 581, A134 [NASA ADS] [CrossRef] [EDP Sciences] [Google Scholar]
- Gehrz, R. D., Evans, A., Helton, L. A., et al. 2015, ApJ, 812, 132 [NASA ADS] [CrossRef] [Google Scholar]
- Güver, T., & Özel, F. 2009, MNRAS, 400, 2050 [NASA ADS] [CrossRef] [Google Scholar]
- Hauschildt, P. H., Wehrse, R., Starrfield, S., & Shaviv, G. 1992, ApJ, 393, 307 [NASA ADS] [CrossRef] [Google Scholar]
- Hauschildt, P. H., Schwarz, G., Short, C. I., et al. 2002, AIP Conf. Proc., 637, 249 [NASA ADS] [CrossRef] [Google Scholar]
- Kalberla, P. M. W., Burton, W. B., Hartmann, D., et al. 2005, A&A, 440, 775 [NASA ADS] [CrossRef] [EDP Sciences] [Google Scholar]
- Munari, U., Maitan, A., Moretti, S., & Tomaselli, S. 2015, New Astron., 40, 28 [NASA ADS] [CrossRef] [Google Scholar]
- Osterbrock, D. E., & Ferland, G. J. 2005, Astrophysics of Gaseous Nebulae and Actie Galactic Nuclei, 2nd edn. (Sacramento, University Science Books) [Google Scholar]
- Payne-Gaposchkin, C. 1957, The Galactic Novae (Amsterdam: North-Holland) [Google Scholar]
- Raskin, G., van Winckel, H., Hensberge, H., et al. 2011, A&A, 526, A69 [NASA ADS] [CrossRef] [EDP Sciences] [Google Scholar]
- Ribeiro, V. A. R. M., Bode, M. F., Darnley, M. J., et al. 2013a, MNRAS, 433, 1991 [NASA ADS] [CrossRef] [Google Scholar]
- Ribeiro, V. A. R. M., Munari, U., & Valisa, P. 2013b, ApJ, 768, 49 [NASA ADS] [CrossRef] [Google Scholar]
- Ribeiro, V. A. R. M., Steffen, W., Chomiuk, L., et al. 2014, ASP Conf. Ser., 490, 349 [NASA ADS] [Google Scholar]
- Schaefer, G. H., ten Brummelaar, T., Gies, D. R., et al. 2014, Nature, 515, 234 [NASA ADS] [CrossRef] [PubMed] [Google Scholar]
- Schwarz, G., Hauschildt, P. H., Starrfield, S., et al. 1997, MNRAS, 284, 669 [NASA ADS] [CrossRef] [Google Scholar]
- Shore, S. N. 2012, BASI, 40, 185 [Google Scholar]
- Shore, S. N. 2013, A&A, 559, L7 [NASA ADS] [CrossRef] [EDP Sciences] [Google Scholar]
- Shore, S. N. 2014, ASP Conf. Ser., 490, 145 [Google Scholar]
- Shore, S. N., & Wahlgren, G. M. 2010, A&A, 515, A108 [NASA ADS] [CrossRef] [EDP Sciences] [Google Scholar]
- Shore, S. N., De Gennaro Aquino, I., Schwarz, G. J., et al. 2013, A&A, 553, A123 [NASA ADS] [CrossRef] [EDP Sciences] [Google Scholar]
- Shore, S. N., De Gennaro Aquino, I., Scaringi, S., & van Winckel, H. 2014, A&A, 570, L4 [NASA ADS] [CrossRef] [EDP Sciences] [Google Scholar]
- Starrfield, S., Iliadis, C., Timmes, F. X., et al. 2012, BASI, 40, 419 [NASA ADS] [Google Scholar]
- Stratton, F. J. M., & Manning, W. H. 1939, Atlas of spectra of Nova Herculis 1934 (Cambridge: Solar Physics Observatory) [Google Scholar]
- Vanlandingham, K. M., Schwarz, G. J., Shore, S. N., & Starrfield, S. 2001, AJ, 121, 1126 [NASA ADS] [CrossRef] [Google Scholar]
- Woudt, P. A., & Ribeiro, V. A. R. M. 2014, ASP Conf. Ser., 490, 1 [Google Scholar]
- Woudt, P. A., Steeghs, D., Karovska, M., et al. 2009, ApJ, 706, 738 [NASA ADS] [CrossRef] [Google Scholar]
Appendix A: 1200−7300 Å full spectral distributions for days 35 (Fe curtain), 99 (transition stage), and 248 (nebular stage)
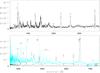 |
Fig. A.1 Panchromatic spectrum of V339 Del on Day 35 obtained combining the STIS (day 35) and FIES (day 25 in cyan and day 46 in black) observations. No extinction corrections have been applied. |
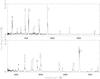 |
Fig. A.2 Panchromatic (STIS+FIES) spectrum for Day 99. |
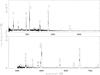 |
Fig. A.3 Same as Fig. A.2 for Day 248. |
All Tables
All Figures
|
Fig. 1 Top: AAVSO visual light curve. Middle: Swift XRT count rate for the period covered by this paper, through Day 300. Bottom: Hardness ratio F(0.45−1 keV)/F(0.3−0.45 keV). The SSS phase is defined to be when the HR < 1. The first FIES/STIS epoch was before, and the second after the appearance of the SSS. |
| In the text | |
|
Fig. 2 Line profile evolution of the transitions NaI D, Fe II 5169 Å, Hγ, and Ca II K in the early decline (day +2 to day +54) HERMES spectra. In each panel time increases from bottom to top. The epoch of each spectrum being on the left side of the figure. The y axis unit (ADU) have been omitted since the spectra are not flux calibrated and the spectral signatures have not been properly removed. However, day 2 transitions are plotted as in the original spectrum with the 0 counts level matching the x axis. The subsequent epochs have been offset by 0.75 ADUs in the case of the NaI D, 0.70 ADUs in the case of the Fe II 5169 Å transition, 0.85 ADUs in the case of Hγ and 3.5 ADUs in the case of the CaII K transition. |
| In the text | |
|
Fig. 3 Line profile evolution of neutral C and O during the early decline monitored at Mercator/HERMES. The C I 7713 Å, [O I] 5577 Å, and [O I] 6300 Å lines are offset with respect to each other by 0.8, 0.75 and 0.75, respectively. The first 5 spectra of OI 8446 Å were offset by 0.5 while the last four were scaled to 0.25 and offset by 1.33 × n, with n being the spectrum position in the sequence. The “0.5, 0.75” and “0.4−0.6” tick-marks indicate the scale in those panels whose x-axis is not matching the 0 ADU level of the y-axis. |
| In the text | |
|
Fig. 4 Line profile of the hydrogen Balmer lines Hβ, Hγ, Hδ, Hζ at day +14 (top panel) and +25 (bottom panel) in the NOT/FIES spectra. The spectra were flux calibrated and the Hγ, Hδ, Hζ lines have been offset with respect to Hβ by the constants −0.5e-11, −1e-11 and −1.5e-11, respectively, in the +14 days spectrum and by the constants −0.75e-11, −1.5e-11 and −2.25e-11, again respectively, in the +25 days spectrum. Note the Balmer progression in the absorption trough: decreasing strength and velocity of the feature and increasingly fragmented structure with increasing series number. |
| In the text | |
|
Fig. 5 Comparison of the line profiles of the UV resonant lines (MgII 2800 Å, CII 1334 Å, and OI 1302 Å) from day 99 with the optical ones NaI D and CaII K (CaII H, in the figure, is blended with Hε). The NaI D had almost disappeared and was blended with He I 5876 Å emission which was the strongest line in the 5800−6000 Å range by this time. |
| In the text | |
|
Fig. 6 O I and O III evolution from the NOT sequence. Left: [O III] 5007 Å (black), 4959 Å (blue); middle: [O I] 6300 Å (black), 6364 Å (blue); right: [O I] 5577 Å. |
| In the text | |
|
Fig. 7 Day 122, for which only optical observations were obtained. Comparison of the Hβ (solid), [N II] 5755 Å (dash), and [O I] 6300 Å (dot-dash) line profiles. No scaling has been applied. Note the change in the relative strength of the individual emission features with ionization stage. |
| In the text | |
|
Fig. 8 Line profile of the C II–IV and N II–V resonant transition at the various epoch for which we have contemporaneous optical and UV observations. See text for more details. |
| In the text | |
|
Fig. 9 Ratio of the C III] 1909 Å flux on day 99 over day 248 flux (solid line) and same for the N IV] 1486 Å (dashed line). Note the strong decrease in the strength of the +600 km s-1 feature and the near identity of the variation for the two lines. In both cases, the weaker component of the doublet is negligible. |
| In the text | |
|
Fig. 10 Interstellar line profiles for O I 1303 Å (dot-dash) and Na I D1 (solid) compared with the LAB 21 cm H I profile (dash) in LSR velocity. The O I profile is from the Day 99 STIS spectrum, that for Na I D1 is from the Day 14 FIES spectrum. |
| In the text | |
|
Fig. 11 Comparison of V339 Del (solid, E(B − V) = 0.18 and divided by 1.6) and OS And 1986 (dot, E(B − V) = 0.25) for Day 38. The fluxes of each are scaled by 10-10 erg s-1 cm-2 Å-1. See text for discussion. |
| In the text | |
|
Fig. 12 Sample model profiles for the Day 99 spectra. Top: N IV] 1486 Å (solid), He II 1640 Å (dot). Bottom: model profiles (flux in arbitrary units). The model parameters are listed for the two simulations. DA RIFARE. |
| In the text | |
|
Fig. 13 Hβ flux (black) and electron density time dependence. The Hβ integrated flux has been measured from the full set of NOT/FIES spectra. The electron density has been obtained from the [O III] analysis, as described in the text only for the NOT/FIES spectra in nebular conditions. The error bars are 1σ errors. The two dotted lines indicate the t-3 dependence and are not a fit to the data points. |
| In the text | |
|
Fig. 14 Time dependence of the inferred filling factor and ejecta mass. Error bars are 1σ. See text for discussion. |
| In the text | |
|
Fig. 15 Flux variations for select lines from the NOT sequence. Dot: Hβ, plus: He II 4686 Å; diamond: [Fe VII] 6087 Å. |
| In the text | |
|
Fig. A.1 Panchromatic spectrum of V339 Del on Day 35 obtained combining the STIS (day 35) and FIES (day 25 in cyan and day 46 in black) observations. No extinction corrections have been applied. |
| In the text | |
|
Fig. A.2 Panchromatic (STIS+FIES) spectrum for Day 99. |
| In the text | |
|
Fig. A.3 Same as Fig. A.2 for Day 248. |
| In the text | |
Current usage metrics show cumulative count of Article Views (full-text article views including HTML views, PDF and ePub downloads, according to the available data) and Abstracts Views on Vision4Press platform.
Data correspond to usage on the plateform after 2015. The current usage metrics is available 48-96 hours after online publication and is updated daily on week days.
Initial download of the metrics may take a while.