Fig. 2
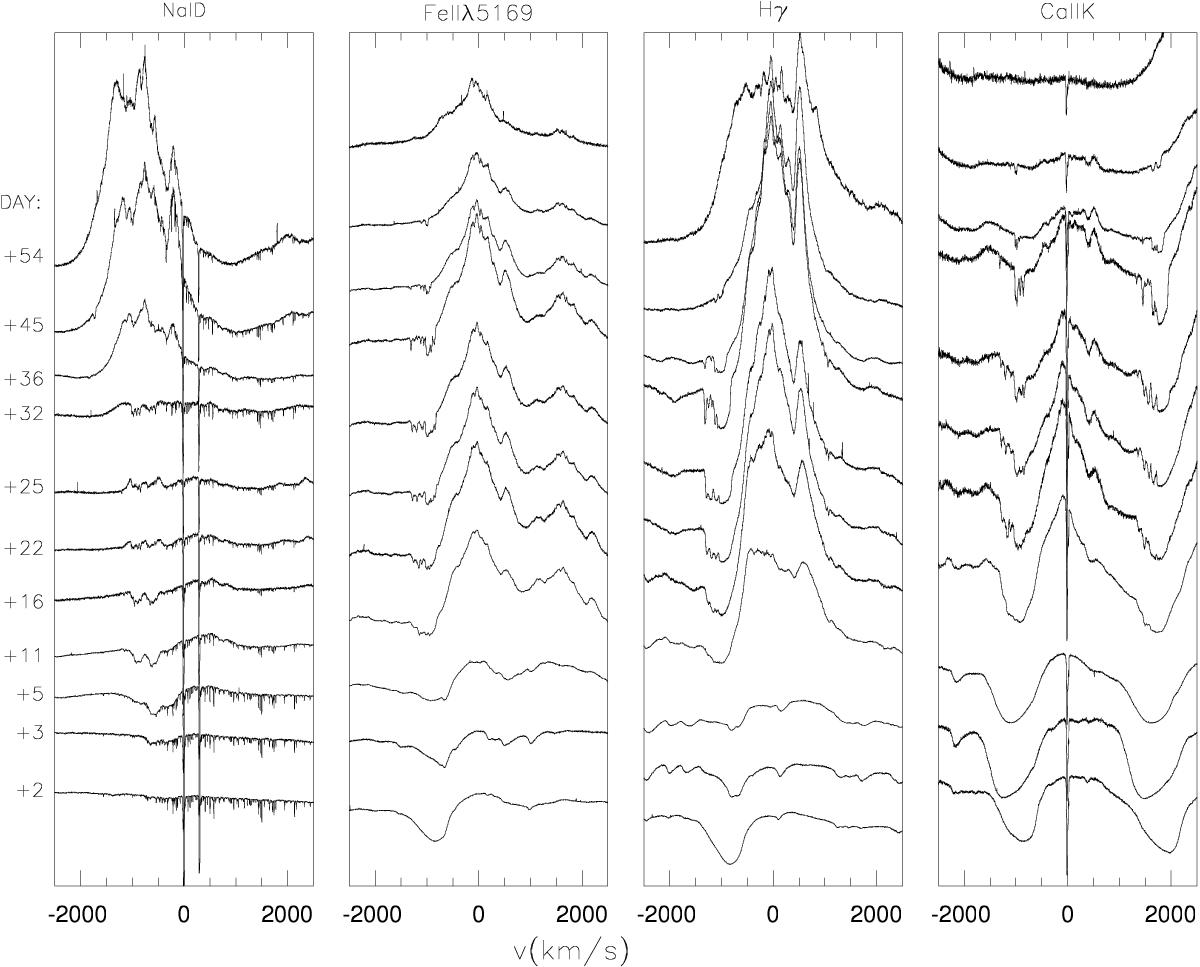
Line profile evolution of the transitions NaI D, Fe II 5169 Å, Hγ, and Ca II K in the early decline (day +2 to day +54) HERMES spectra. In each panel time increases from bottom to top. The epoch of each spectrum being on the left side of the figure. The y axis unit (ADU) have been omitted since the spectra are not flux calibrated and the spectral signatures have not been properly removed. However, day 2 transitions are plotted as in the original spectrum with the 0 counts level matching the x axis. The subsequent epochs have been offset by 0.75 ADUs in the case of the NaI D, 0.70 ADUs in the case of the Fe II 5169 Å transition, 0.85 ADUs in the case of Hγ and 3.5 ADUs in the case of the CaII K transition.
Current usage metrics show cumulative count of Article Views (full-text article views including HTML views, PDF and ePub downloads, according to the available data) and Abstracts Views on Vision4Press platform.
Data correspond to usage on the plateform after 2015. The current usage metrics is available 48-96 hours after online publication and is updated daily on week days.
Initial download of the metrics may take a while.