Fig. 5
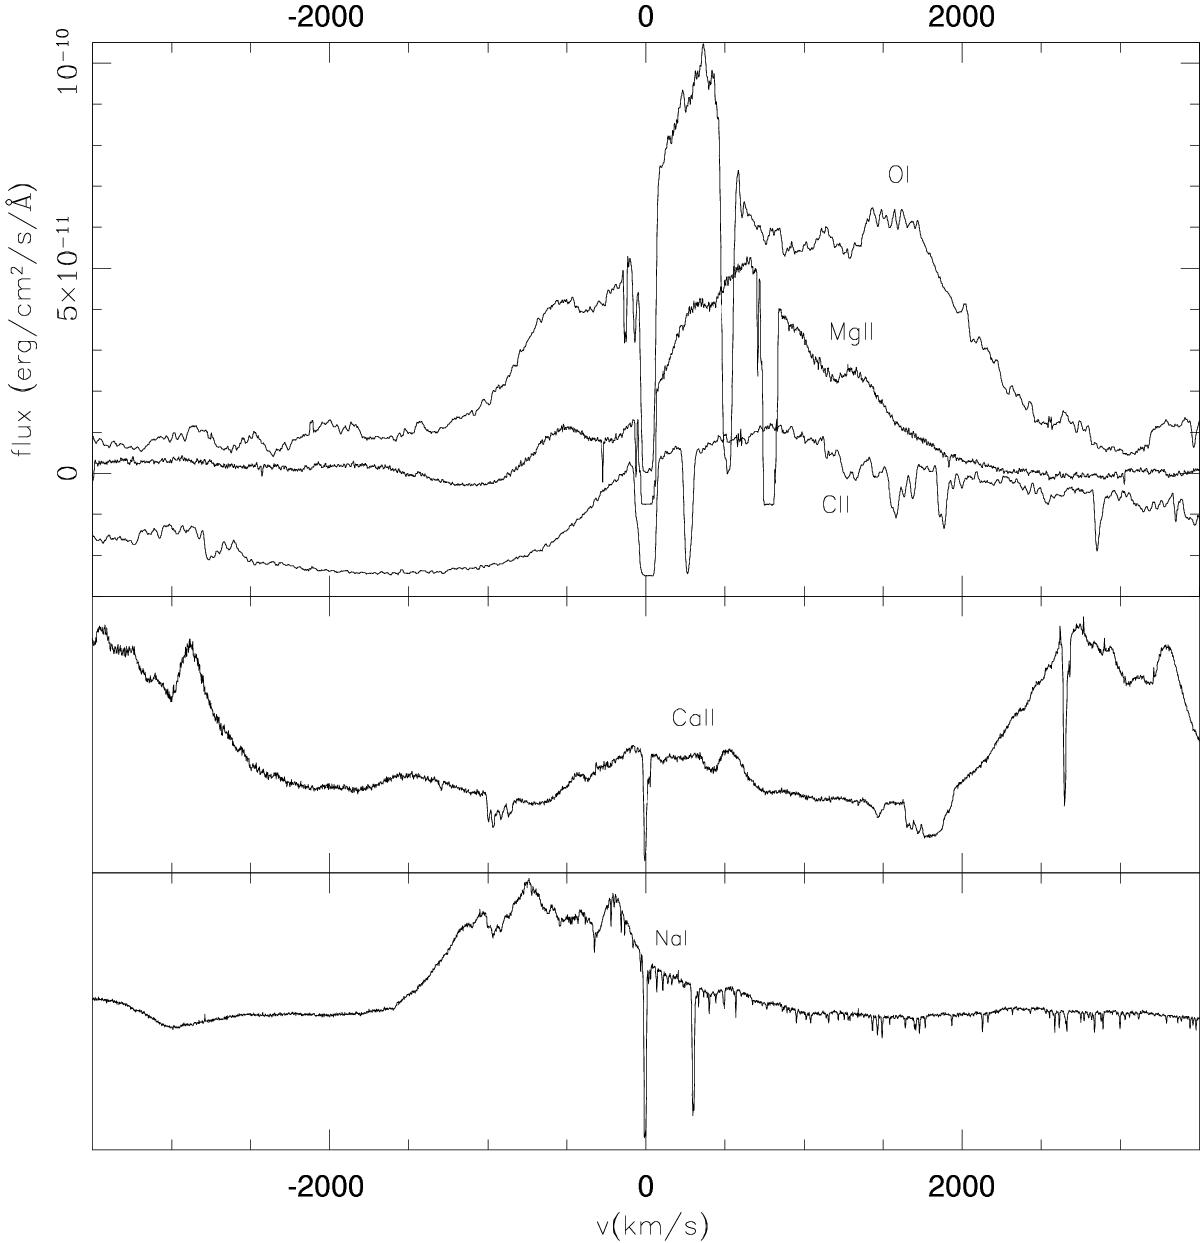
Comparison of the line profiles of the UV resonant lines (MgII 2800 Å, CII 1334 Å, and OI 1302 Å) from day 99 with the optical ones NaI D and CaII K (CaII H, in the figure, is blended with Hε). The NaI D had almost disappeared and was blended with He I 5876 Å emission which was the strongest line in the 5800−6000 Å range by this time.
Current usage metrics show cumulative count of Article Views (full-text article views including HTML views, PDF and ePub downloads, according to the available data) and Abstracts Views on Vision4Press platform.
Data correspond to usage on the plateform after 2015. The current usage metrics is available 48-96 hours after online publication and is updated daily on week days.
Initial download of the metrics may take a while.