Fig. 13
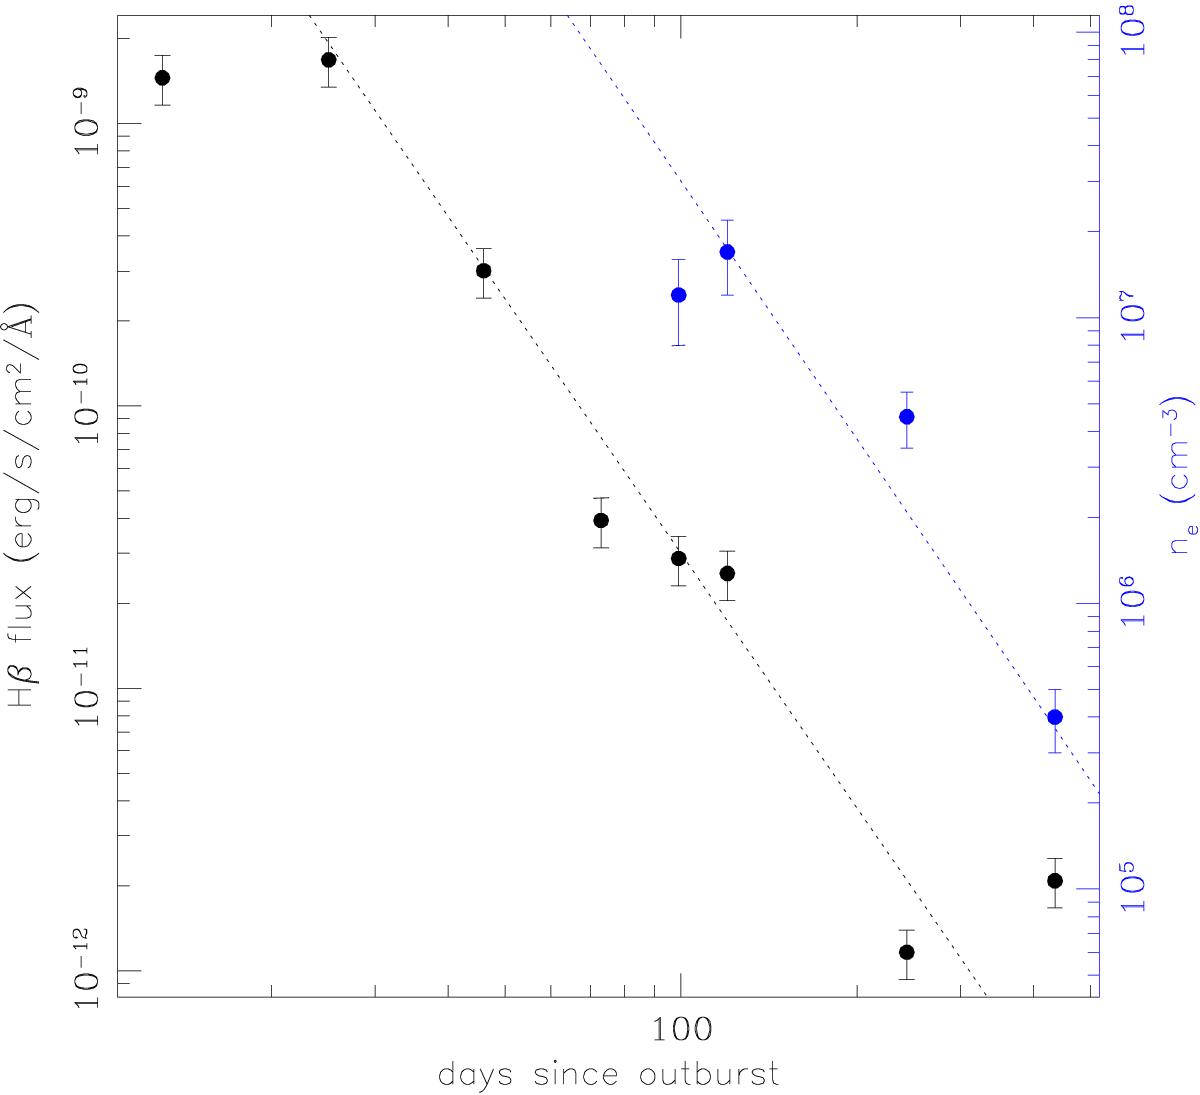
Hβ flux (black) and electron density time dependence. The Hβ integrated flux has been measured from the full set of NOT/FIES spectra. The electron density has been obtained from the [O III] analysis, as described in the text only for the NOT/FIES spectra in nebular conditions. The error bars are 1σ errors. The two dotted lines indicate the t-3 dependence and are not a fit to the data points.
Current usage metrics show cumulative count of Article Views (full-text article views including HTML views, PDF and ePub downloads, according to the available data) and Abstracts Views on Vision4Press platform.
Data correspond to usage on the plateform after 2015. The current usage metrics is available 48-96 hours after online publication and is updated daily on week days.
Initial download of the metrics may take a while.