Fig. 3
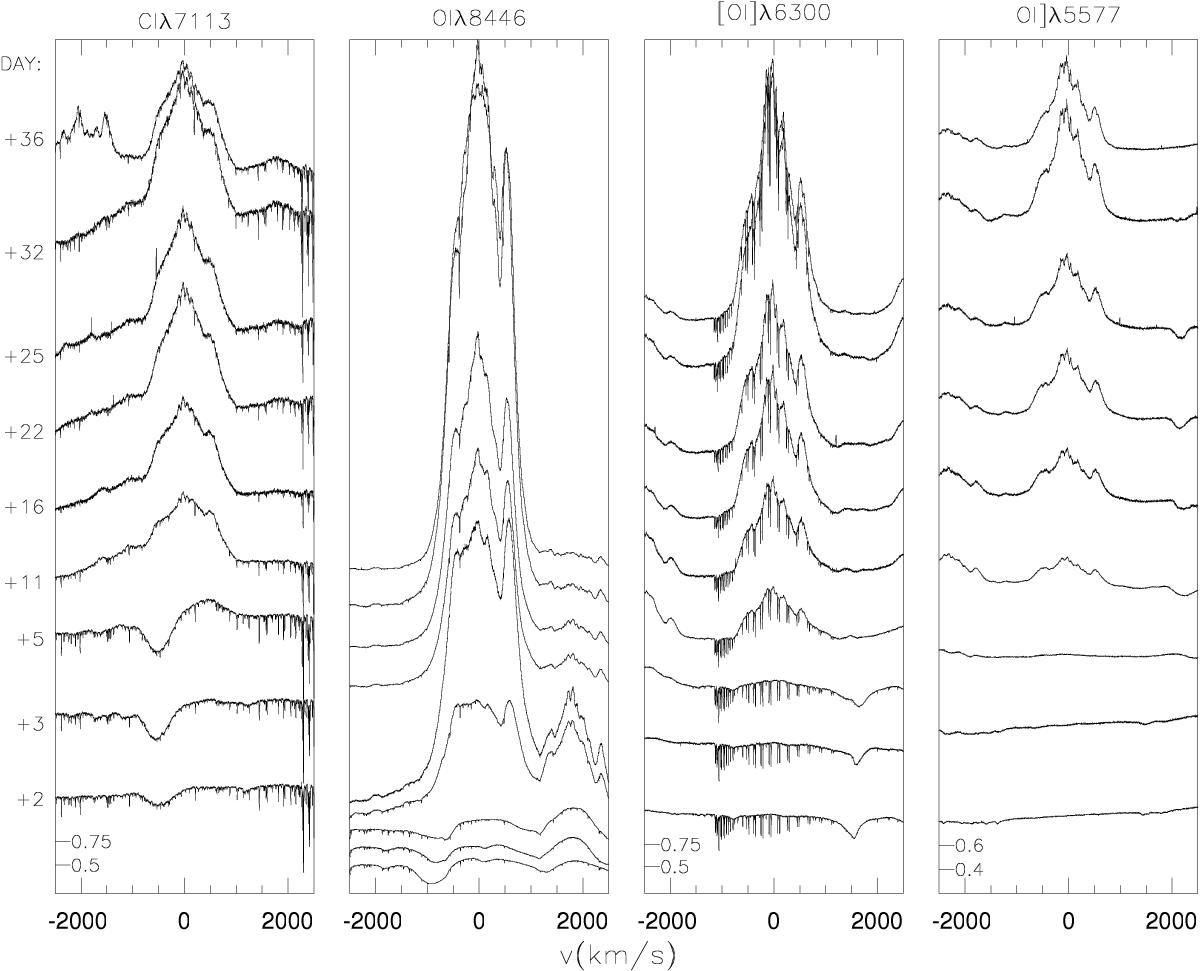
Line profile evolution of neutral C and O during the early decline monitored at Mercator/HERMES. The C I 7713 Å, [O I] 5577 Å, and [O I] 6300 Å lines are offset with respect to each other by 0.8, 0.75 and 0.75, respectively. The first 5 spectra of OI 8446 Å were offset by 0.5 while the last four were scaled to 0.25 and offset by 1.33 × n, with n being the spectrum position in the sequence. The “0.5, 0.75” and “0.4−0.6” tick-marks indicate the scale in those panels whose x-axis is not matching the 0 ADU level of the y-axis.
Current usage metrics show cumulative count of Article Views (full-text article views including HTML views, PDF and ePub downloads, according to the available data) and Abstracts Views on Vision4Press platform.
Data correspond to usage on the plateform after 2015. The current usage metrics is available 48-96 hours after online publication and is updated daily on week days.
Initial download of the metrics may take a while.