Fig. 4
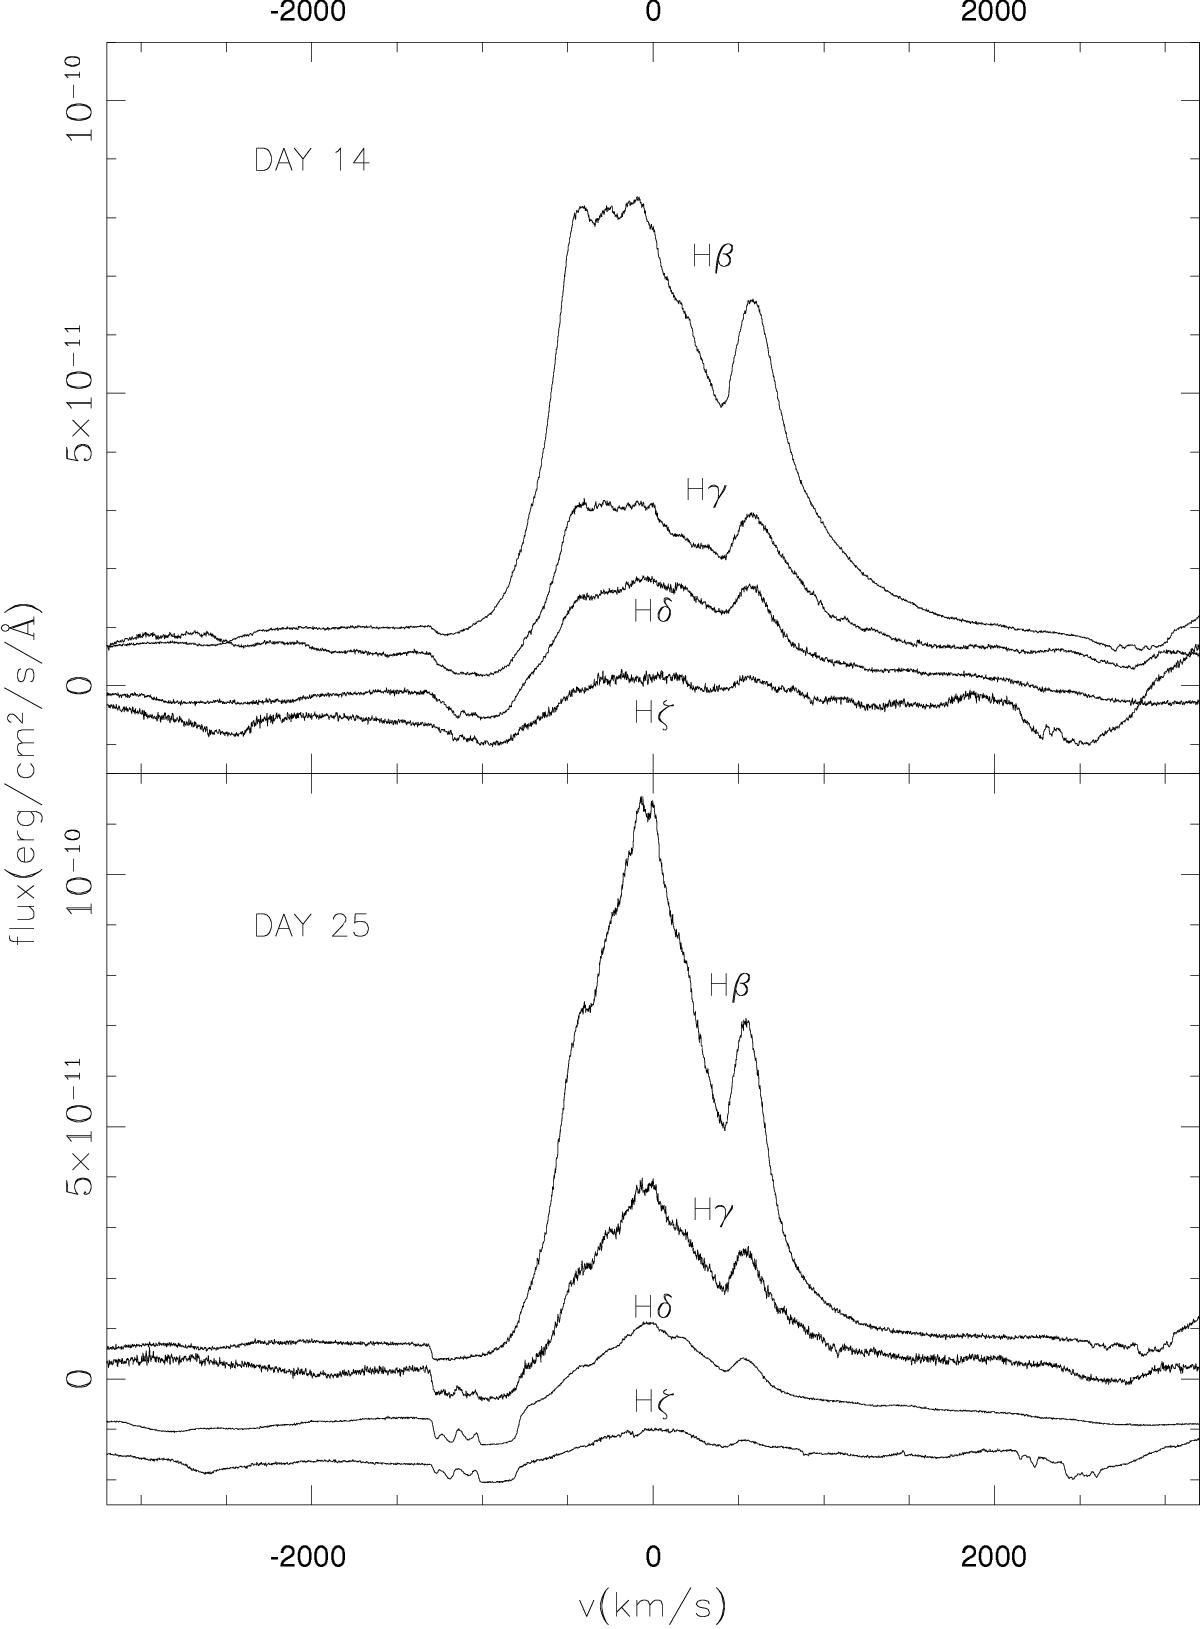
Line profile of the hydrogen Balmer lines Hβ, Hγ, Hδ, Hζ at day +14 (top panel) and +25 (bottom panel) in the NOT/FIES spectra. The spectra were flux calibrated and the Hγ, Hδ, Hζ lines have been offset with respect to Hβ by the constants −0.5e-11, −1e-11 and −1.5e-11, respectively, in the +14 days spectrum and by the constants −0.75e-11, −1.5e-11 and −2.25e-11, again respectively, in the +25 days spectrum. Note the Balmer progression in the absorption trough: decreasing strength and velocity of the feature and increasingly fragmented structure with increasing series number.
Current usage metrics show cumulative count of Article Views (full-text article views including HTML views, PDF and ePub downloads, according to the available data) and Abstracts Views on Vision4Press platform.
Data correspond to usage on the plateform after 2015. The current usage metrics is available 48-96 hours after online publication and is updated daily on week days.
Initial download of the metrics may take a while.