| Issue |
A&A
Volume 586, February 2016
|
|
|---|---|---|
| Article Number | A48 | |
| Number of page(s) | 10 | |
| Section | Extragalactic astronomy | |
| DOI | https://doi.org/10.1051/0004-6361/201526927 | |
| Published online | 25 January 2016 | |
The HST view of the innermost narrow line region
1
Dipartimento di Fisica e Astronomia, Università di
Firenze, via G. Sansone
1, 50019 Sesto
Fiorentino ( Firenze), Italy
e-mail:
This email address is being protected from spambots. You need JavaScript enabled to view it.
2
INAF–Osservatorio Astrofisico di Arcetri, Largo Enrico Fermi
5, 50125
Firenze,
Italy
3
INAF–Osservatorio Astrofisico di Torino, via Osservatorio
20, 10025
Pino Torinese,
Italy
4
Department of Physics, Technion, 3200
Haifa,
Israel
5
Department of Physics and Astronomy, The University,
Southampton
SO17 1BJ,
UK
Received: 10 July 2015
Accepted: 25 November 2015
Abstract
We analyze the properties of the innermost narrow line region in a sample of low-luminosity AGN. We select 33 LINERs (bona fide AGN) and Seyfert galaxies from the optical spectroscopic Palomar survey observed by HST/STIS. We find that in LINERs the [ N II ] and [ O I ] lines are broader than the [ S II ] line and that the [ N II ] /[ S II ] flux ratio increases when moving from ground-based to HST spectra. This effect is more pronounced considering the wings of the lines. Our interpretation is that, as a result of superior HST spatial resolution, we isolate a compact region of dense ionized gas in LINERs, located at a typical distance of ~3 pc and with a gas density of ~104–105 cm-3, which we identify with the outer portion of the intermediate line region (ILR). Instead, we do not observe these kinds of effects in Seyferts; this may be the result of a stronger dilution from the NLR emission, since the HST slit maps a larger region in these sources. Alternatively, we argue that the innermost, higher density component of the ILR is only present in Seyferts, while it is truncated at larger radii because of the presence of the circumnuclear torus. The ILR is only visible in its entirety in LINERs because the obscuring torus is not present in these sources.
Key words: galaxies: active / galaxies: nuclei / galaxies: Seyfert
© ESO, 2016
1. Introduction
The narrow line region (NLR) is a unique laboratory to explore the properties of the interstellar medium at the boundary between the host galaxy and the region dominated by the active galactic nucleus (AGN). This is the region where most of the energy exchange between the AGN and its host galaxies occurs. In the nearby Universe, many strong and prominent narrow emission lines are accessible in the optical bands. For these reasons, the properties of the NLR has been extensively explored since the 80s with ground-based spectra. For example, the spectroscopic survey of bright nearby galaxies (Filippenko & Sargent 1985; Ho et al. 1995), hereafter the Palomar survey, provides a unique catalog of optical spectra and narrow emission line measurements. However, as a result of the superior spatial resolution of HST, we have the opportunity to explore the properties of the innermost NLR, unaccessible by the ground-based observations. The HST might provide us with a different view, particularly for nearby, low-luminosity AGN with respect to what is seen at larger scales.
In the early literature there are disagreements between different studies. This is likely because of the small size of the samples and/or low-resolution effects. In particular, it is not clear how properties of the emitting gas (ionization level, temperature, density, reddening, velocities, etc.) are linked to the characteristics of the AGN, such as its luminosity or spectral type. Evidence for both positive correlations between line width and ionization/critical density of the lines are observed in a number of LINERs (Filippenko & Sargent 1985) or Seyferts (Veilleux 1991; Moore et al. 1996); in other cases a negative correlation emerges (e.g., Veilleux 1991). These studies indicate that a relation between the density and/or ionization parameter exists with velocity, at least in some objects. Since the velocity increases toward the center, these observed correlations imply that the density and/or ionization parameter gradually increases inward in the NLR of these galaxies. However, the main results about the correlations of line width (and also on the presence of overall line blueshift) with ionization potential and/or critical density are based on emission lines of high ionization ([Fe VII]λ6087, [Fe X]λ6374, [Ne III]λ3869; e.g., Marconi et al. 1996) but no variation in width is found between, for example, [ O I ] and [ S II ] (see, for example, Fig. 3b in Moore & Cohen 1994).
With the advent of HST, a structure characterized by emission line velocities intermediate between those from the broad line region (BLR) and NLR has been identified in Seyferts (e.g., Crenshaw & Kraemer 2007; Crenshaw et al. 2009). This region has been called intermediate line region (ILR). Assuming that the velocity widths of the ILR is primarily due to gravitational motion, the distance from the ILR to the central ionizing source is ~0.1−1 pc. In this region, the different velocities of the lines can be explained as the result of outflowing gas or a stratification in the ionization state and/or density of the gas (Kraemer & Crenshaw 2000).
Sample galaxies and log of the HST/STIS observations.
The importance of the NLR density stratification has been demonstrated, e.g., for its impact on our ability to isolate the BLR emission in low-luminosity AGN. A widely used strategy consists in using the [S II] doublet as a template to subtract the contribution of the narrow emission lines to the Hα+[N II] complex. In HST spectra, however, the [O I] line is generally broader than the [S II] line and using the [O I] doublet instead of [S II] leads to completely different results. We have shown in Balmaverde & Capetti (2014) that this approach does not lead, in general, to robust constraints on the properties of the BLR in low-luminosity AGN.
In this paper we focus on the view of the NLR by ground-based and HST/STIS spectra, analyzing the profile parameters of low ionization emission lines ([ O I ] λλ6300, 6363, [ N II ] λλ6548, 6584, Hα, and [S II]λλ6716, 6731). We take advantage of the high spatial resolution of HST to deal with the still debated topic of the gas density stratification of the NLR and on the relation between the emission line width and the critical density of the gas in nearby AGN.
The paper is organized as follows. In Sect. 2 we present the sample and methodology of spectral analysis. In Sect. 3 we compare the properties of the emission line profile in HST and Palomar spectra, then we present the main result for LINERs (Sect. 4) and Seyferts (Sect. 5). In Sects. 6 and 7 we provide a discussion, our summary, and conclusions.
2. Sample selection and analysis of the spectra
Filippenko & Sargent (1985) and Ho et al. (1995) present the results of an optical spectroscopic survey, performed with the Palomar 5 m Hale telescope, of 486 nearby bright galaxies (BT ≤ 12.5 mag) located in the northern sky (hereafter referred to as the Palomar survey). We consider the 106 galaxies in this survey robustly classified in Ho et al. (1997) as Seyfert, LINER, or transition objects between these two classes (according to the spectroscopic criteria proposed by Veilleux & Osterbrock 1987). We searched the Hubble Legacy Archive (HLA) for spectroscopic observations performed by HST/STIS with G750M grating1 and centered to cover the Hα emission line. We found 42 observations, but we discarded nine sources (namely NGC 3254, NGC 4261, NGC 4314, NGC 4594) because of the poor quality of the spectra, NGC 4138 and NGC 4374 because the slit was not centered on the nucleus, and NGC 3368, NGC 4636, and NGC 4736 because they are likely not AGN (see Balmaverde & Capetti 2015 for details). Our final sample is therefore composed of 33 sources, which we list in Table 1.
All the reduced and calibrated spectra of the Palomar survey are available through the NASA Extragalactic Database (NED). The long slit spectra obtained with the red camera cover the wavelengths between 6210 and 6860 Å with a resolution of ~2.5 Å. We use the Gandalf software (Sarzi et al. 2006) to model and subtract starlight emission. The residuals contain the emission lines, and the most prominent in the spectral range considered are [ O I ] λλ6300, 6363, [ N II ] λλ6548, 6584, Hα, and [S II]λλ6716, 6731. We fit these lines with the IDL routine mpfit that employs a χ2 minimization procedure. We model each line with two Gaussians to reproduce both the narrow core component and the broad wings, and we derive the line properties by summing the two components. The [ N II ] doublet ratio is fixed to the expected value of 1:3 (Humphrey et al. 2008), while the widths of [ N II ] and Hα are assumed to be equal. For the type 1 AGN we add a broad Hα component with a broken power-law profile, which can reproduce both asymmetric and skewed profiles (Nagao et al. 2006).
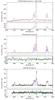 |
Fig. 1 NGC 4036, as an example of the spectral analysis performed on a galaxies of the sample. We show the Palomar spectrum in the top panel (black), the best-fit starlight model (red) and, in the inset below, the residuals. In the middle panel, we present the fit to the emission lines (red lines) and the different components (blue lines). The HST is shown in the bottom panel with the same symbols used for the Palomar spectrum. |
We consider public HST/STIS spectra in the HLA (see Table 1). The G750M grism covers the range between 5450 and 10 140 Å with a resolving power of R ~ 5000, with 572 Å covered in each tilt position. When possible, we combine multiple observations to remove cosmic rays and bad pixels. From the fully calibrated data, we extract the nuclear spectrum from a synthetic aperture of 0.̋15. In the HST spectra the continuum emission does not show a significant presence of absorption features from stars. We then simply reproduce the continuum in the HST spectra as a constant (or at most with a first degree polynomial) without performing a starlight subtraction. The fit to the emission lines follows the same strategy described above.
For two of the type I Seyfert (namely NGC 3516 and NGC 4051), the BLR profile is too complex to be reproduced with any analytical form and the measurements of the narrow lines in the [ N II ] + Hα complex is compromised. For these objects, we adopted a different strategy: we only considered the [ O I ] and the [ S II ] lines by locally fitting a second order polynomial to reproduce the continuum and BLR wings.
The analysis of the HST spectra revealed the possible presence of another LINER with a broad Hα line, namely NGC 3642. This LINER shows an increase in the narrow line widths from the Palomar to the HST data by a factor of more than ~3, which is significantly larger than observed in the other galaxies. We believe that this is an indication of the presence of a BLR and, thus, we include this component in the model fitting.
As an example, we show in Fig. 1 the Palomar (before and after starlight subtraction) and the HST spectra of NGC 4036. In Table 3 we report fluxes and full widths at half maximum (FWHM) of each line (measured on the sum of the two Gaussian components).
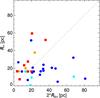 |
Fig. 2 Projected size of the region covered by the HST slit versus the diameter of the black hole sphere of influence (both in parsec). Red squares represent Seyferts2, orange squares Seyferts1, blue dots LINERs2, and cyan dots LINERs1. |
3. Emission lines properties
The highest spatial resolution of HST offers the unique opportunity to explore the properties of the innermost region of the NLR (hereafter INLR). Indeed, the HST aperture is 0.2′′ (or even 0.1′′) × 0.15′′, which is much smaller than the 2′′× 4′′ aperture of the Palomar survey, and provides us with a much better spatial resolution. As a result, the flux of the [ N II ] line in HST spectra is lower than in the Palomar spectra: the ratio between these two fluxes ranges from 1 to 20 in LINERs and from 4 to 40 in Seyferts.
In Fig. 2, we compare the linear dimension of the region covered by the HST slit with the diameter of the black hole (BH) sphere of influence, whose radius is defined as  , where σ⋆ is the stellar velocity dispersion. This is the region within which the gravitational potential is dominated by the presence of the supermassive BH (whose mass is estimated from the values of σ⋆ reported in Table 1, adopting the Tremaine et al. 2002 relation). In the LINERs, the diameter of the BH sphere of influence is between 4 and 81 pc with a median of 21 pc, larger than the median distance covered by the slit (16 pc). Indeed, in all but three LINERs, the HST spectra probe a region confined within the BH sphere of influence.
This is not the case for the Seyferts, in which the sphere of influence is only comparable to the slit size in three cases. In general, this region is unresolved, mainly because of the lower BH masses in these objects with respect to LINERs.
3.1. Ground-based vs. HST measurements
Initially we focus on the [ N II ] emission line (the brightest line in these spectra) as seen in the HST and ground-based spectra. In Fig. 3, left panel, we compare the FWHM[ N II ] measurements in the Palomar and HST spectra. We do not see any significant change of the FWHM moving from ground-based to HST spectra in the Seyferts (the median are 243 and 252 km s-1, respectively; see Table 2). Instead, in the LINERs of our sample, the median FWHM[ N II ] grows from 389 to 564 km s-1. This is likely because in LINERs, opposite from what happens in Seyferts, the HST slit is well within the sphere of influence of the BH, where the velocities sharply increase toward the center.
The prevalence of gravitational motions in the NLR of the objects considered (as opposed to, e.g., a kinematic dominated by the effects of the AGN) is supported by the comparison between the central stellar velocity dispersion and FWHM[ N II ] measured from HST spectra. Considering only the LINERs, the FWHM[ N II ] correlates with the stellar velocity dispersion (with a linear correlation coefficient of 0.8 and a slope of ~3); see Fig. 3, right panel. The line widths are in general higher than 2.35 × σ⋆ (where 2.35 is the conversion factor from dispersion to FWHM) by just ~25%. Also, in the Seyferts FWHM[ N II ] correlates with σ⋆, but with a shallower slope.
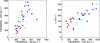 |
Fig. 3 Left panel: comparison of the FWHM of [ N II ] emission line from HST and Palomar spectra. The dashed line is the bisectrix of the plane and the dotted lines enclose a region of ±100 km s-1 centered on the bisectrix. Symbols as in Fig. 2. NGC 4486 falls outside the plotting range. Right panel: stellar velocity dispersion in km s-1versus the FWHM of the [ N II ] emission line. The dashed line corresponds to FWHM[ N II ] = 2.35 × σ⋆. |
In the assumption of the dominance of gravitational motions and, for the LINERs, the prevalence of the BH potential, we can convert the observed velocities into distances by assuming Keplerian rotation, i.e., RINLR ~ GMBH/ (f FWHM2). The parameter f is a geometric factor that depends on the structure of these innermost regions of the NLR. We adopt  as valid for an isotropic distribution of randomly moving clouds (Peterson et al. 2004)2. We find a range of radii between 1 <RFW [ NII ]< 10 parsec with a median radius of 3.0 parsec.
Line widths comparisons.
As a useful comparison, we calculate the dust sublimation radius Rd for the LINERs using the relationship given by Elitzur (2008), i.e., 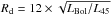 pc; the bolometric luminosity is derived from the [ O III ] line luminosity as LBol = 3500 × L[ OIII ] (Heckman et al. 2004). In Fig. 4, we compare the radius of the INLR (estimated for all LINERS and for the three Seyfert with resolved spheres of influence) with the dust sublimation radius: these two regions are essentially the same size in all objects, where RFWHM [ NII ] is typically a factor four larger, although with a substantial spread.
In the other Seyferts, the sphere of influence is not resolved but we can nonetheless derive constraints on the line emitting gas location. An upper limit to the size of the INLR is simply related to the slit size, and a lower limit is imposed by the radius at which the line width would exceed the observed values: if the INLR was smaller that this limit we would observe broader lines. The resulting ranges, shown as vertical segments in Fig. 4, are typically of ~10 pc, generally slightly larger than the dust sublimation radius.
The mass of ionized gas in the INLR can be estimated from the following observed Balmer line luminosity (Osterbrock 1989):
 We converted the measured LHα into LHβ by adopting a standard 3.1 ratio (e.g., Gaskell 1984). By assuming a temperature of 104 K, i.e., a recombination coefficient
 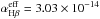 cm3 s-1, and a density of ne = 104 cm-3, we find a range Mgas between 102 and 105 (104/ne) M⊙ with a median value of 103.8M⊙.
Forbidden line measurements.
3.2. Comparison of line widths and intensities
We now analyze the behavior of the [ S II ] and [ O I ] emission lines and compare it to the results obtained for [ N II ] discussed above. In ground-based spectra the [ N II ] and [ S II ] emission line do not show any remarkable differences in their FWHM (see Table 2). Conversely, in the HST spectra the LINERs have a median FWHM([ N II ] ) 22% larger than FWHM([ S II ] ), 564 km s-1 against 463 km s-1 (Fig. 5, top panels). These differences are even more pronounced considering the wings of the lines (bottom left panel), which are defined as the difference in velocity between the 10th and 90th percentile (see Sect. 3.3 for a definition of the percentiles) with an increase of 28%. This broadening effect is limited to a change of ~10% in the Seyferts.
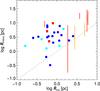 |
Fig. 4 Logarithm of the dust sublimation radius versus size of the INLR for the LINERs and for the three Seyfert with resolved spheres of influence, all in pc units. For the remaining Seyferts we draw the allowed ranges of the INLR size as vertical segments (see text for details). |
The information about the [ O I ] line is significantly less complete. In fact, the [ O I ] doublet, depending on the central wavelength selected for the HST observations, might fall outside the spectra or, in other cases, only the weakest [ O I ] λ6363 line of the doublet is visible. Moreover, this line is intrinsically fainter with respect to the other lines considered and the quality of the spectra is often not sufficient to obtain a reliable fit to the data. For these reasons, measurements of [ O I ] are reported for only 18 objects. In Fig. 5, bottom right panel, we plot FWHM([ O I ] ) versus FWHM([ S II ] ). We find that for most of the LINERs the [ O I ] velocity dispersion is higher than [ S II ] (the mean values in this subsample are 740 and 495 km s-1, respectively). Instead, for the Seyferts the FWHM of [ O I ] and [ S II ] do not differ significantly.
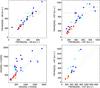 |
Fig. 5 Comparison of the FWHM of the [ N II ] and [ S II ] emission lines from Palomar (top left) and HST (top right) spectra. NGC 4486 falls outside the plotting range. In the bottom left panel, we used the differences between the velocity defined at 10% and 90% of the total flux instead. In bottom right panel, we compare the FWHM of the [ O I ] and [ S II ] lines. Symbols as in Fig. 2. |
The intensity ratio of the two lines forming [ S II ] doublet is commonly used to derive the electron density of the gas. This ratio decreases from [ S II ] λ6716/[ S II ] λ6731 ~ 1.4 to ~0.4 when the gas density increases from ne ~ 10 to ~104 cm-3. For even higher density the [ S II ] doublet intensity ratio is insensitive to ne. In Fig. 6 we compare the [ S II ] doublet ratios observed in HST and Palomar spectra. In LINERs this ratio is always larger in the ground-based than in HST spectra, with a median value increasing from ~1.2 to 0.8. The corresponding ne variation is from ~102 to ~103 cm-3. The value measured in HST spectra is often close to its high density limit. For the Seyferts, there is a decrease in this ratio, but less pronounced, from ~1.0 to ~0.8.
We now consider the relative intensity of the [ N II ] and [ S II ] emission lines. The ratios between the [ N II ] and [ S II ] fluxes in the Palomar spectra R[ N II ] / [ S II ] span a wide range of values, from ~1 to ~4. In all but two LINERs there is a significant increase of R[ N II ] / [ S II ] from the Palomar data to the HST spectra, typically by a factor two (see Fig. 7).
3.3. INLR tomography
So far we have considered mainly the global properties of the emission lines, however, the lines are well resolved, particularly in the HST spectra. This enables us to consider separately the emission produced in different wavelength ranges, i.e., at different velocities. In particular, the wings of the lines sample regions located closer to the central black hole. In Fig. 8, upper panel, we show an example of this analysis for the LINER NGC 4143. We superpose the [ N II ] model line, obtained from the HST spectrum, to the [ S II ] model line. We align the peaks of the two lines and normalize each line to its total flux. We consider velocities at different percentile of the [ S II ] flux. For example, v5 is defined as the velocity at which the line blue wing contains 5% of the total flux. We similarly define the velocities associated with the percentiles 10% and 30% on the blue wing, and 70%, 90%, and 95% on the red wing. In each of these wings we evaluate R[ N II ] / [ S II ]. This is reported in the same figure and associated with the corresponding velocity: the ratio increases from the value ~3 measured in the Palomar spectrum, to ~3.5 for the whole line in the HST observations, and consistently grows on both wings to ~9.
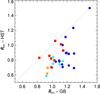 |
Fig. 6 [ S II ] λ6716/[ S II ] λ6731 flux ratio measured from Palomar and HST data. |
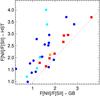 |
Fig. 7 Comparison of the ratios of the [ N II ] and [ S II ] fluxes measured from ground-based and HST spectra. |
We repeated this analysis for all LINERs of the sample, by also deriving a radius at which the wing emission is produced, based on the assumption of Keplerian rotation. In Fig. 8, lower panel, we plot the median ratios obtained in each wing (normalized to the ground-based value) and the corresponding median radius. The radial distances reach ~1 pc for the 5% and 95% percentiles, and we observe an increase of the ratio by a factor ~5 times with respect to the value measured from the ground.
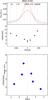 |
Fig. 8 [ N II ] emission line (in black) superposed to the [ S II ] emission line (in red) derived from the fit model for NGC 4143. We indicate the velocities at different percentiles of the total line flux (5%, 10% and 30%, 70%, 90%, and 95%). The green triangle represent the ratio measured from the ground. In the bottom panel, we report the median of the R[ N II / [ S II ] ratio for all the LINERs in the wings, normalized to the values observed from the ground. This is compared with the median radius of the emitting region, based on the assumption of Keplerian rotation. |
4. The properties of the INLR in LINERs
We summarize the main results obtained so far for the LINERs:
-
the BH sphere of influence is resolved at the HST resolution in almost all galaxies;
-
the velocity dispersion of the [ N II ] line correlates with the stellar velocity dispersion: this supports the idea that the INLR motions are dominated by the BH potential;
-
with the virial assumption, we can convert the FWHM velocity to a radial distance from the BH and we obtain a range of characteristic radii of the INLR between 1 and 10 pc, with a median of ~3 pc.
-
the radius of the INLR is ~4 times the dust sublimation radius;
-
in the Palomar spectra, the velocity dispersion of the [ N II ] does not differ from that of the [ S II ] . In the HST spectra, the FWHM of the [ N II ] line is significantly larger with respect to the FWHM of [ S II ] , particularly when considering the wings of the lines. The same broadening effect is seen considering the width of the [ O I ] line with respect to [ S II ] ;
-
the ratio of the two [ S II ] lines decreases from Palomar to HST spectra, indicating an increase in the gas density;
-
the ratio between the [ N II ] and the [ S II ] increases from Palomar to HST spectra; we observe a further increase in the wings of the lines (probing a region extending over just one pc) with respect to the whole line in the HST spectra.
The superior HST spatial resolution enables us to probe the innermost part of the NLR that in ground-based spectra is swamped by emission produced from gas located out to ~100 pc. The changes in line widths and ratios indicate that the physical conditions of the INLR gas in the parsec region differ from what is seen at larger scales.
In particular, we noticed differences in the widths and intensity ratio between [ N II ] and [ S II ] . Their ratio depends on many factors, i.e., the ISM metallicity, the electron density of the emitting gas, and the properties of the ionizing continuum. No strong dependence of the gas ionization level or temperature is instead expected since the ionization potentials for [ S II ] and [ N II ] are similar3. When considering individual sources, the dominant parameter is then the gas density since the [ S II ] doublet emission has a much lower critical density with respect to [ N II ] . The presence of regions where the density exceeds the critical density of [ S II ] produces an increase of the [ N II ] /[ S II ] intensity ratio. This effect becomes more prominent where the gas velocity is larger, i.e., at the smallest radii on the order of one pc. This leads to larger [ N II ] widths and suppression of the [ S II ] emission in the line wings.
The picture that emerges is that the INLR in LINERs is characterized by the presence of a structure of ~104 solar masses of ionized gas located at a typical radius of ~3 pc, a distance at which the gravitational potential is dominated by the central BH. The changes of line widths and line ratios (when moving from the large scale sampled by the Palomar data to the HST spectra, but also seen in the comparison between the lines cores and wings) are all accounted for by a density stratification within the INLR. In particular, this implies the presence of regions where the gas density largely exceeds the critical density of the [ S II ] lines and possibly reaches values as high as the [ N II ] critical density, i.e., ~105 cm-3. The density and gas velocity are intermediate between those measured in the NLR and in the BLR and this is reminiscent of the properties of the ILR, initially identified in UV spectra of Seyferts. Therefore, we suggest that our optical spectra are mapping the outer portion of the ILR.
5. The properties of the INLR in Seyfert galaxies
The situation for the Seyfert galaxies is radically different. We do not observe any significant change in the lines widths and ratios from the Palomar to the HST spectra, both for the lines as a whole and for the line wings. The only variation is seen for the relative intensity of the [ S II ] doublet, indicative of a modest density increase from the large-scale NLR to the INLR from a few hundreds to ~103cm-3. The lack of variation in the [ S II ] width and ratio against [ N II ] and [ O I ] suggests that there is no evidence for emission from gas in the INLR with a density intermediate between the [ S II ] and [ O I ] critical density.
In the Seyferts even HST does not, in general, resolve the BH sphere of influence. We found only three exceptions (namely, NGC 5194, NGC 4698, and NGC 4501; see Fig. 2), and all of these are type 2 objects. We estimate a radial distance of the emitting gas in the same way we have done for LINERs. In Fig. 4 we compare RFWHM [ NII ] with the dust sublimation radius: these three Seyferts span a similar range in radial distance from the BH (between 2 and 10 parsec) covered by the LINERs, and larger than the dust sublimation radius, Rd, by a factor 2 to 10. Since Rd can be associated with the inner radius of the circumnuclear obscuring structure, the observed gas lies, most likely, above (and below) the torus. As shown in Fig. 4, this result also applies to the remaining Seyferts.
We conclude that the pc scale structure of ionized (and stratified) gas seen in LINERs, which we identify as the outer portion of the ILR, is not visible in Seyfert galaxies. The gas seen in the HST spectra appears to be simply the extension of the large-scale NLR to smaller radii, probably located at the base of the ionization cones with densities reaching at most ~103 cm-3.
For Seyfert type 2, there is the possibility that the ILR might be obscured by the torus. Unfortunately, we have only three type 1 Seyferts with HST data and in only one (NGC 3227), and we are able to deblend the Hα broad emission from the Hα+[ N II ] complex reliably. Thus, we measure the flux and FWHM of [ N II ] . For another type 1 Seyfert (NGC 3516), we can only compare the width of the [ O I ] and [ S II ] with no apparent broadening. Although this analysis is only limited to two objects, both behave like the type 2 Seyfert.
A possible explanation is that the emission originating from the outer portion of the ILR is diluted by the NLR emission. In fact, in Seyferts the HST slit maps a larger region and, therefore, the different behavior observed in LINERs and Seyferts can be ascribed to resolution effects. Only the coronal lines of higher ionization coming from more dense, compact and, therefore, bright regions show the existence of the ILR. Conversely, the stratification effect is not evident in optical lines produced in the more tenuous and diffuse medium at larger scale.
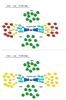 |
Fig. 9 Schematic view of the ILR in Seyfert galaxies (top panel) and in LINER galaxies (bottom panel). The image is not on scale. |
6. Discussion
The topic of NLR stratification has been the subject of many studies (see, for example, Whittle 1985 and references therein). In particular, Whittle found no correlations between widths and critical density or ionization potential in the five Seyfert 2 studied, which is in line with our results. These correlations are instead found for Seyfert 1 and, in general, the stronger trend is between the line width and its critical density, apparently in contrast with our findings. However, this study takes advantage of the analysis of a larger number of lines, whose critical densities reach much higher values that those considered in our analysis with values in excess of ~107 cm-3. The comparisons between the [ O I ] and [ S II ] widths, possible for eleven sources, do not show any significant differences (with only one exception, namely MRK 9), again, in agreement with our results. The NLR density stratification is present but it is associated with much denser gas than sampled by the lines present in the HST data we considered. We can envisage that this occurs at very small radii, well inside the obscuring torus. The results presented by Nagao et al. (2001) support this interpretation since they found difference in the properties of the [ O III ]λ4363 line, having a critical density of 107.41 cm-3, between Sy 1 and Sy 2. They argue that this line, as well as other high ionization lines, can be produced from the inner wall of the torus. Other studies found that indeed high ionization emission lines are stronger in Sy1s than in Sy2s (Murayama & Taniguchi 1998, 1998a; Nagao et al. 2000; Baskin & Laor 2005; Baldi et al. 2013; Dicken et al. 2014).
Our results on the NLR properties of low-luminosity AGN are accounted for by considering the interplay between the line emitting regions and the obscuring torus (see Fig. 9 for a schematic view). A toroidal absorbing structure is required in Seyferts (e.g., Antonucci 1993) to explain the differences between type 1 and type 2 objects. Seyfert 2 galaxies are indeed characterized by high values of hydrogen column density and about half of nearby Seyfert 2 are Compton thick, i.e., have NH> 1024 cm-2 (Guainazzi et al. 2005). Conversely, several pieces of evidence point to the conclusion that the obscuring torus is in general not present in LINERs. In particular, the main effect associated with the torus, i.e., the absorption in the X-ray spectra, is not visible in this class of AGN (Balmaverde & Capetti 2015) with NH rarely exceeding ~1022 cm-2.
The overall structure of the emission line region in LINERs can be described as a gas distribution in which the density smoothly decreases moving outward. In Seyfert galaxies, the circumnuclear gas becomes optically thick for the UV ionizing photons, thus, forming the obscuring torus. The molecular torus produces a gap in the observed gas density distribution, occurring on a scale of ~3 pc and corresponding to densities in the range 104–106 cm-3. At even smaller radii, within the dust sublimation radius, the density further increases leading to the known link between critical density and line width.
The results obtained for the LINERs are reminiscent of what was found by Capetti et al. (2005) analyzing HST narrowband images in low-luminosity FR I radio galaxies. These authors similarly identify a compact emission line region extending on pc-scale. In line with their interpretation, we suggest that the ILR takes the form of an ionized, optically thin torus. We suggest that this tenuous structure is present only in LINERs because of the general paucity of gas and dust in their nuclear regions. This also causes their low rate of accretion and low bolometric luminosity. A standard torus can only form in more powerful AGN associated with larger amounts of nuclear gas and dust.
7. Summary and conclusions
The aim of this paper is to compare the properties of the optical emission lines of the NLR as seen in HST/STIS and in ground-based spectra in low-luminosity AGN. The superior spatial resolution of HST offers the possibility of exploring the properties of the innermost regions of the NLR with respect to what is seen at larger scales.
We consider 33 Seyferts and LINERs galaxies from the Palomar sample observed by HST/STIS with the high-resolution grism centered to cover the Hα emission. We compare the width and intensity ratio between different emission lines in Palomar and HST spectra.
In LINERs, we find that the FWHM of the [ N II ] and the ratio between the intensity of [ N II ] and [ S II ] increase from Palomar to HST spectra, and it is even higher in the wings of the lines (defined at different percentiles of the flux). This could be interpreted as evidence that the gas density increases toward the center, exceeding the [ S II ] critical density. Assuming that the kinematic is dominated by the BH gravitational potential, we convert the velocities to a radial distance from the BH and we find radii on the order of ~1−10 pc. We identify this compact, high density region, as the outer portion of the intermediate line region or ILR.
This region is instead invisible in Seyferts, where the line widths and ratios do not change significantly from the ground-based to HST data and do not differ in the different lines.
The absorption in the X-ray data indicates that the standard torus is present in Seyferts, while it is generally absent in LINERs. Therefore, the most plausible scenario is that in LINERs the ILR takes the place of the circumnuclear torus. We suggest that the outer ILR, the region of optically thin, ionized gas, and the optically thick torus are mutually exclusive
structure. A standard torus is only present in powerful AGN associated with larger amounts of nuclear gas and dust. Instead, in LINERs, as a result of the general paucity of interstellar material in their nuclear regions, only a tenuous, ionized, and optically thin structure can form.
The different gas structure in Seyfert and LINERs indicates that the latter class is a superior target for BH mass measurements based on gas dynamics. The presence of the ILR, in fact, represents the ideal component for such a study, as it extends well within the BH sphere of influence and it contains a large fraction of the total line emission. Conversely, in Seyferts, most of the emission from the lines commonly used is produced outside the obscuring torus. Our results suggest that, for Seyferts, lines of higher critical density (such as, for example, [Ne III]λ3869 and [Ne V]λλ3346, 3426) that are emitted at smaller radii should be considered.
The spectral resolution of the G750L grism is insufficient for our purposes.
Peterson et al. (2004) adopted  but they measured the line dispersion instead of the FWHM. This value is equivalent to
  in Blandford et al. (1990) that used FWHM velocities. An empirical derived value of f = 5.5 is reported by Onken et al. (2004).
The ionization potentials are 23.33, 13.6, and 29.6 eV, for [ S II ] , [ O I ] and [ N II ] , respectively (Moore 1970). The logarithms of critical densities, in cm-3 units, are 3.2, 3.6, 6.3, and 4.9 for [S II]λ6716, [S II]λ6731, [O I]λ6300, and [N II]λ6584, respectively (Appenzeller & Oestreicher 1988).
Acknowledgments
This research has made use of the NASA/IPAC Extragalactic Database (NED), which is operated by the Jet Propulsion Laboratory, California Institute of Technology, under contract with the National Aeronautics and Space Administration. We thank the referee for her/his useful suggestions and comments.
References
- Antonucci, R. 1993, ARA&A, 31, 473 [Google Scholar]
- Appenzeller, I., & Oestreicher, R. 1988, AJ, 95, 45 [NASA ADS] [CrossRef] [Google Scholar]
- Baldi, R. D., Capetti, A., Buttiglione, S., Chiaberge, M., & Celotti, A. 2013, A&A, 560, A81 [NASA ADS] [CrossRef] [EDP Sciences] [Google Scholar]
- Balmaverde, B., & Capetti, A. 2014, A&A, 563, A119 [NASA ADS] [CrossRef] [EDP Sciences] [Google Scholar]
- Balmaverde, B., & Capetti, A. 2015, A&A, 581, A76 [NASA ADS] [CrossRef] [EDP Sciences] [Google Scholar]
- Baskin, A., & Laor, A. 2005, MNRAS, 358, 1043 [NASA ADS] [CrossRef] [Google Scholar]
- Blandford, R. D., Netzer, H., Woltjer, L., Courvoisier, T. J.-L., & Mayor, M. 1990, Active Galactic Nuclei (Berlin: Springer-Verlag) [Google Scholar]
- Capetti, A., Verdoes Kleijn, G., & Chiaberge, M. 2005, A&A, 439, 935 [NASA ADS] [CrossRef] [EDP Sciences] [Google Scholar]
- Crenshaw, D. M., & Kraemer, S. B. 2007, ApJ, 659, 250 [NASA ADS] [CrossRef] [Google Scholar]
- Crenshaw, D. M., Kraemer, S. B., Schmitt, H. R., et al. 2009, ApJ, 698, 281 [NASA ADS] [CrossRef] [Google Scholar]
- Dicken, D., Tadhunter, C., Morganti, R., et al. 2014, ApJ, 788, 98 [NASA ADS] [CrossRef] [Google Scholar]
- Elitzur, M. 2008, New Astron. Rev., 52, 274 [NASA ADS] [CrossRef] [Google Scholar]
- Filippenko, A. V., & Sargent, W. L. W. 1985, ApJS, 57, 503 [NASA ADS] [CrossRef] [Google Scholar]
- Gaskell, C. M. 1984, Astrophys. Lett., 24, 43 [NASA ADS] [Google Scholar]
- Guainazzi, M., Matt, G., & Perola, G. C. 2005, A&A, 444, 119 [NASA ADS] [CrossRef] [EDP Sciences] [Google Scholar]
- Heckman, T. M., Kauffmann, G., Brinchmann, J., et al. 2004, ApJ, 613, 109 [NASA ADS] [CrossRef] [Google Scholar]
- Ho, L. C., Filippenko, A. V., & Sargent, W. L. 1995, ApJS, 98, 477 [NASA ADS] [CrossRef] [Google Scholar]
- Ho, L. C., Filippenko, A. V., & Sargent, W. L. W. 1997, ApJS, 112, 315 [NASA ADS] [CrossRef] [Google Scholar]
- Ho, L. C., Greene, J. E., Filippenko, A. V., & Sargent, W. L. W. 2009, ApJS, 183, 1 [NASA ADS] [CrossRef] [Google Scholar]
- Humphrey, A., Villar-Martín, M., Vernet, J., et al. 2008, MNRAS, 383, 11 [NASA ADS] [CrossRef] [Google Scholar]
- Kraemer, S. B., & Crenshaw, D. M. 2000, ApJ, 532, 256 [NASA ADS] [CrossRef] [Google Scholar]
- Marconi, A., van der Werf, P. P., Moorwood, A. F. M., & Oliva, E. 1996, A&A, 315, 335 [NASA ADS] [Google Scholar]
- Moore, C. E. 1970, Ionization potentials and ionization limits derived from the analyses of optical spectra [Google Scholar]
- Moore, D., & Cohen, R. D. 1994, ApJ, 433, 602 [NASA ADS] [CrossRef] [Google Scholar]
- Moore, D., Cohen, R. D., & Marcy, G. W. 1996, ApJ, 470, 280 [NASA ADS] [CrossRef] [Google Scholar]
- Murayama, T., & Taniguchi, Y. 1998, ApJ, 503, L115 [NASA ADS] [CrossRef] [Google Scholar]
- Nagao, T., Murayama, T., Taniguchi, Y., & Yoshida, M. 2000, AJ, 119, 620 [Google Scholar]
- Nagao, T., Murayama, T., & Taniguchi, Y. 2001, ApJ, 546, 744 [NASA ADS] [CrossRef] [Google Scholar]
- Nagao, T., Marconi, A., & Maiolino, R. 2006, A&A, 447, 157 [NASA ADS] [CrossRef] [EDP Sciences] [Google Scholar]
- Onken, C. A., Ferrarese, L., Merritt, D., et al. 2004, ApJ, 615, 645 [NASA ADS] [CrossRef] [Google Scholar]
- Osterbrock, D. E. 1989, Astrophysics of gaseous nebulae and active galactic nuclei, 422 [Google Scholar]
- Peterson, B. M., Ferrarese, L., Gilbert, K. M., et al. 2004, ApJ, 613, 682 [NASA ADS] [CrossRef] [Google Scholar]
- Sarzi, M., Falcón-Barroso, J., Davies, R. L., et al. 2006, MNRAS, 366, 1151 [NASA ADS] [CrossRef] [Google Scholar]
- Tremaine, S., Gebhardt, K., Bender, R., et al. 2002, ApJ, 574, 740 [NASA ADS] [CrossRef] [Google Scholar]
- Veilleux, S. 1991, ApJ, 369, 331 [NASA ADS] [CrossRef] [Google Scholar]
- Veilleux, S., & Osterbrock, D. E. 1987, ApJS, 63, 295 [NASA ADS] [CrossRef] [Google Scholar]
- Whittle, M. 1985, MNRAS, 216, 817 [NASA ADS] [CrossRef] [Google Scholar]
All Tables
All Figures
|
Fig. 1 NGC 4036, as an example of the spectral analysis performed on a galaxies of the sample. We show the Palomar spectrum in the top panel (black), the best-fit starlight model (red) and, in the inset below, the residuals. In the middle panel, we present the fit to the emission lines (red lines) and the different components (blue lines). The HST is shown in the bottom panel with the same symbols used for the Palomar spectrum. |
| In the text | |
|
Fig. 2 Projected size of the region covered by the HST slit versus the diameter of the black hole sphere of influence (both in parsec). Red squares represent Seyferts2, orange squares Seyferts1, blue dots LINERs2, and cyan dots LINERs1. |
| In the text | |
|
Fig. 3 Left panel: comparison of the FWHM of [ N II ] emission line from HST and Palomar spectra. The dashed line is the bisectrix of the plane and the dotted lines enclose a region of ±100 km s-1 centered on the bisectrix. Symbols as in Fig. 2. NGC 4486 falls outside the plotting range. Right panel: stellar velocity dispersion in km s-1versus the FWHM of the [ N II ] emission line. The dashed line corresponds to FWHM[ N II ] = 2.35 × σ⋆. |
| In the text | |
|
Fig. 4 Logarithm of the dust sublimation radius versus size of the INLR for the LINERs and for the three Seyfert with resolved spheres of influence, all in pc units. For the remaining Seyferts we draw the allowed ranges of the INLR size as vertical segments (see text for details). |
| In the text | |
|
Fig. 5 Comparison of the FWHM of the [ N II ] and [ S II ] emission lines from Palomar (top left) and HST (top right) spectra. NGC 4486 falls outside the plotting range. In the bottom left panel, we used the differences between the velocity defined at 10% and 90% of the total flux instead. In bottom right panel, we compare the FWHM of the [ O I ] and [ S II ] lines. Symbols as in Fig. 2. |
| In the text | |
|
Fig. 6 [ S II ] λ6716/[ S II ] λ6731 flux ratio measured from Palomar and HST data. |
| In the text | |
|
Fig. 7 Comparison of the ratios of the [ N II ] and [ S II ] fluxes measured from ground-based and HST spectra. |
| In the text | |
|
Fig. 8 [ N II ] emission line (in black) superposed to the [ S II ] emission line (in red) derived from the fit model for NGC 4143. We indicate the velocities at different percentiles of the total line flux (5%, 10% and 30%, 70%, 90%, and 95%). The green triangle represent the ratio measured from the ground. In the bottom panel, we report the median of the R[ N II / [ S II ] ratio for all the LINERs in the wings, normalized to the values observed from the ground. This is compared with the median radius of the emitting region, based on the assumption of Keplerian rotation. |
| In the text | |
|
Fig. 9 Schematic view of the ILR in Seyfert galaxies (top panel) and in LINER galaxies (bottom panel). The image is not on scale. |
| In the text | |
Current usage metrics show cumulative count of Article Views (full-text article views including HTML views, PDF and ePub downloads, according to the available data) and Abstracts Views on Vision4Press platform.
Data correspond to usage on the plateform after 2015. The current usage metrics is available 48-96 hours after online publication and is updated daily on week days.
Initial download of the metrics may take a while.