Fig. 8
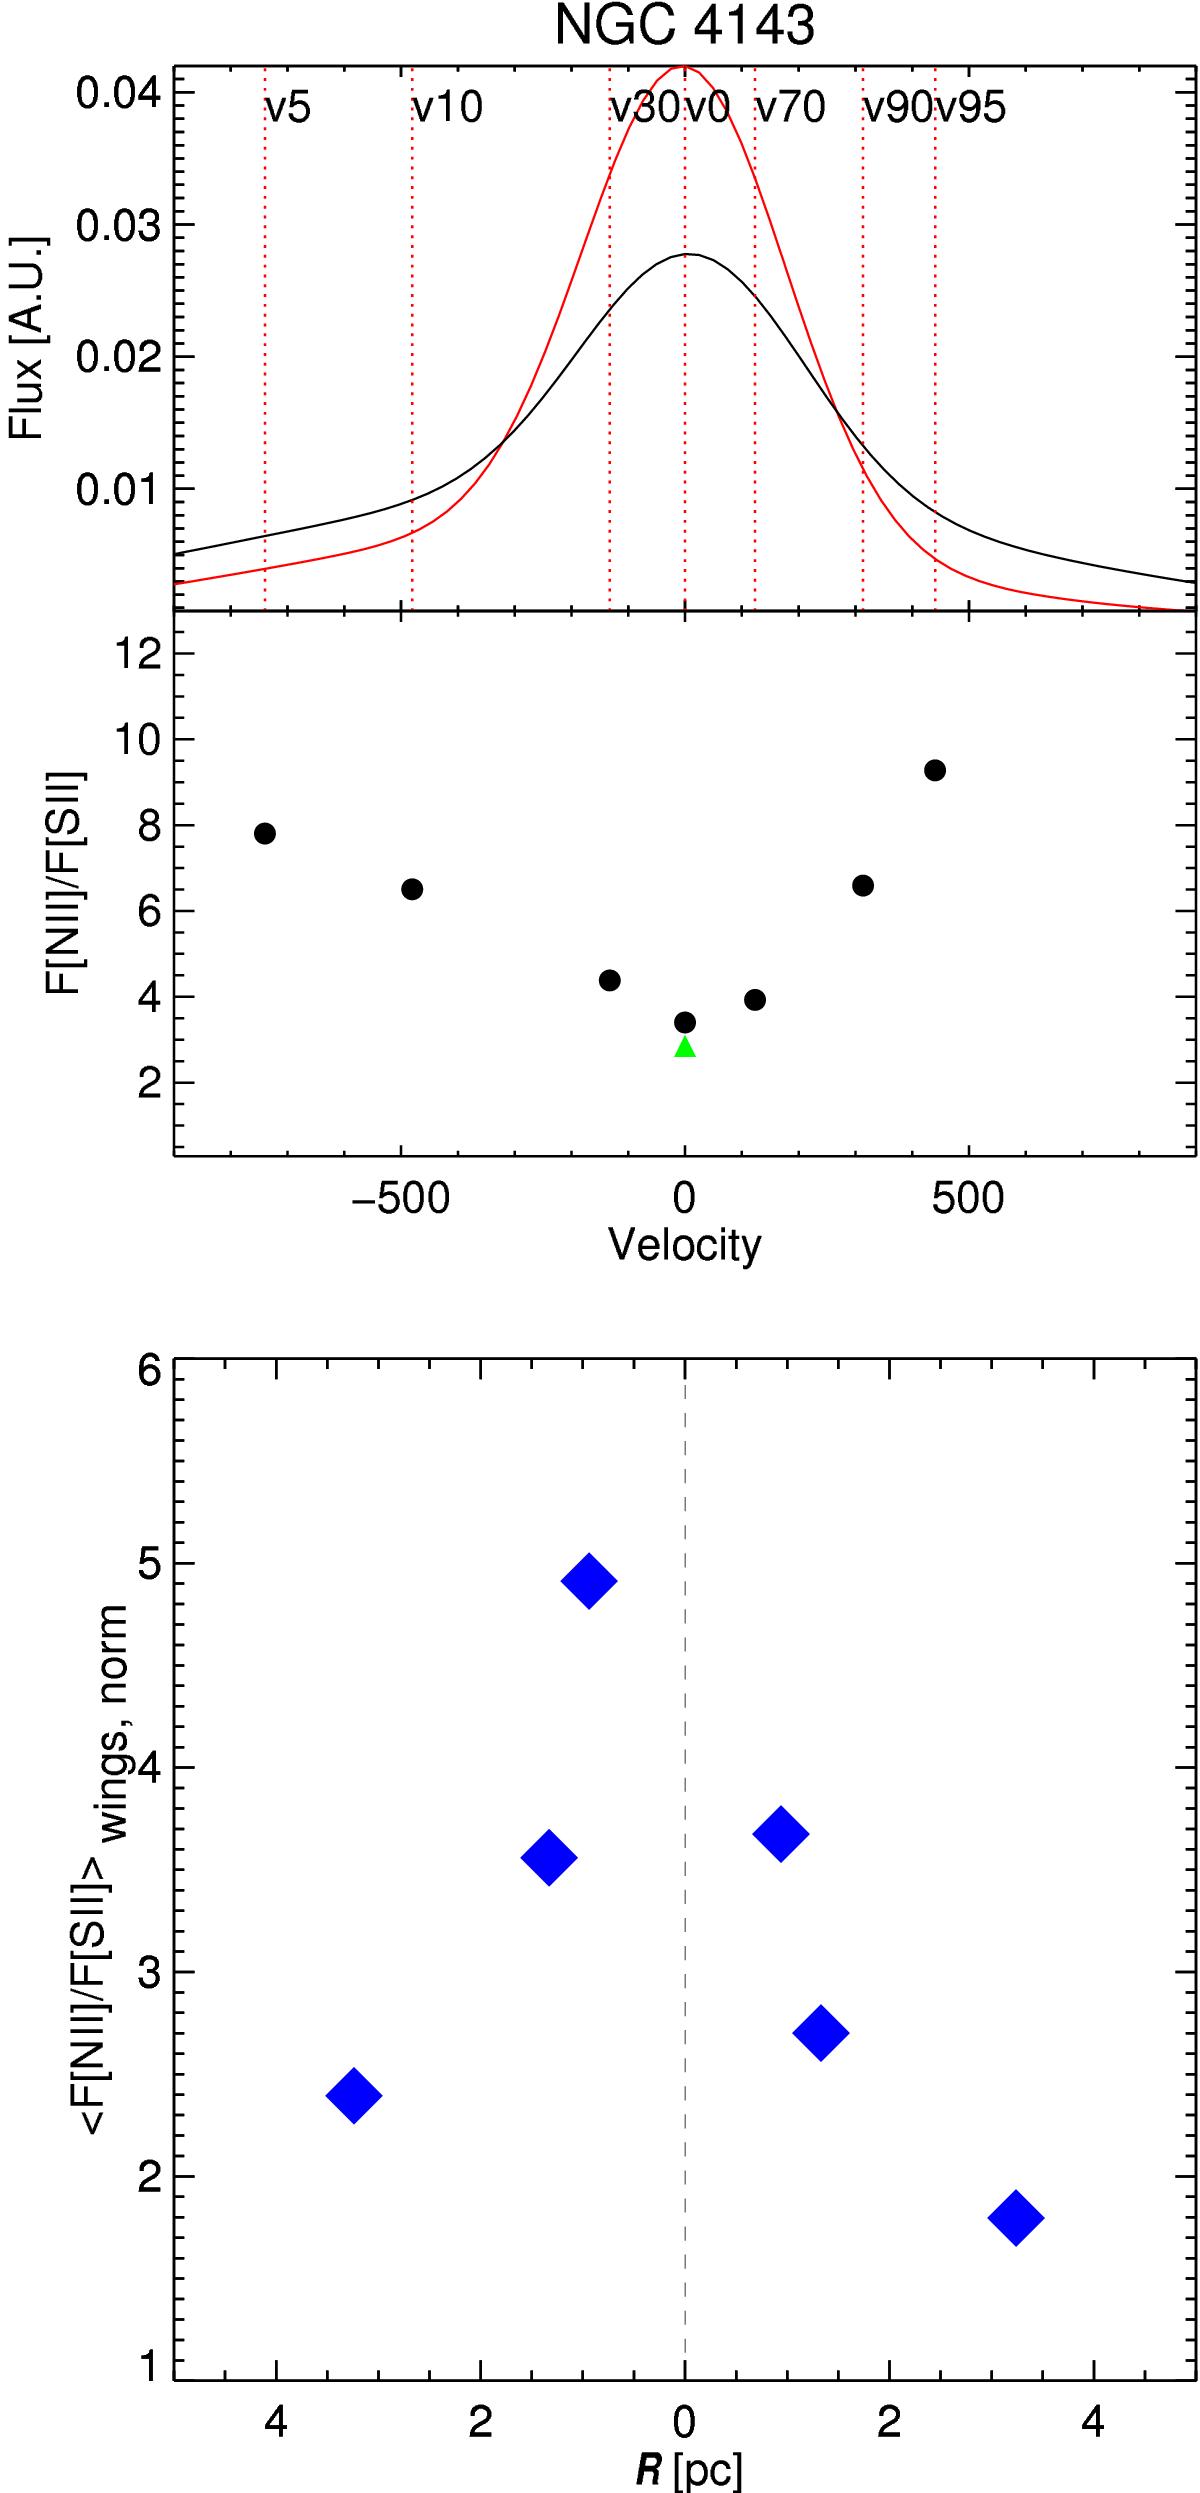
[ N II ] emission line (in black) superposed to the [ S II ] emission line (in red) derived from the fit model for NGC 4143. We indicate the velocities at different percentiles of the total line flux (5%, 10% and 30%, 70%, 90%, and 95%). The green triangle represent the ratio measured from the ground. In the bottom panel, we report the median of the R[ N II / [ S II ] ratio for all the LINERs in the wings, normalized to the values observed from the ground. This is compared with the median radius of the emitting region, based on the assumption of Keplerian rotation.
Current usage metrics show cumulative count of Article Views (full-text article views including HTML views, PDF and ePub downloads, according to the available data) and Abstracts Views on Vision4Press platform.
Data correspond to usage on the plateform after 2015. The current usage metrics is available 48-96 hours after online publication and is updated daily on week days.
Initial download of the metrics may take a while.