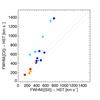
Fig. 5
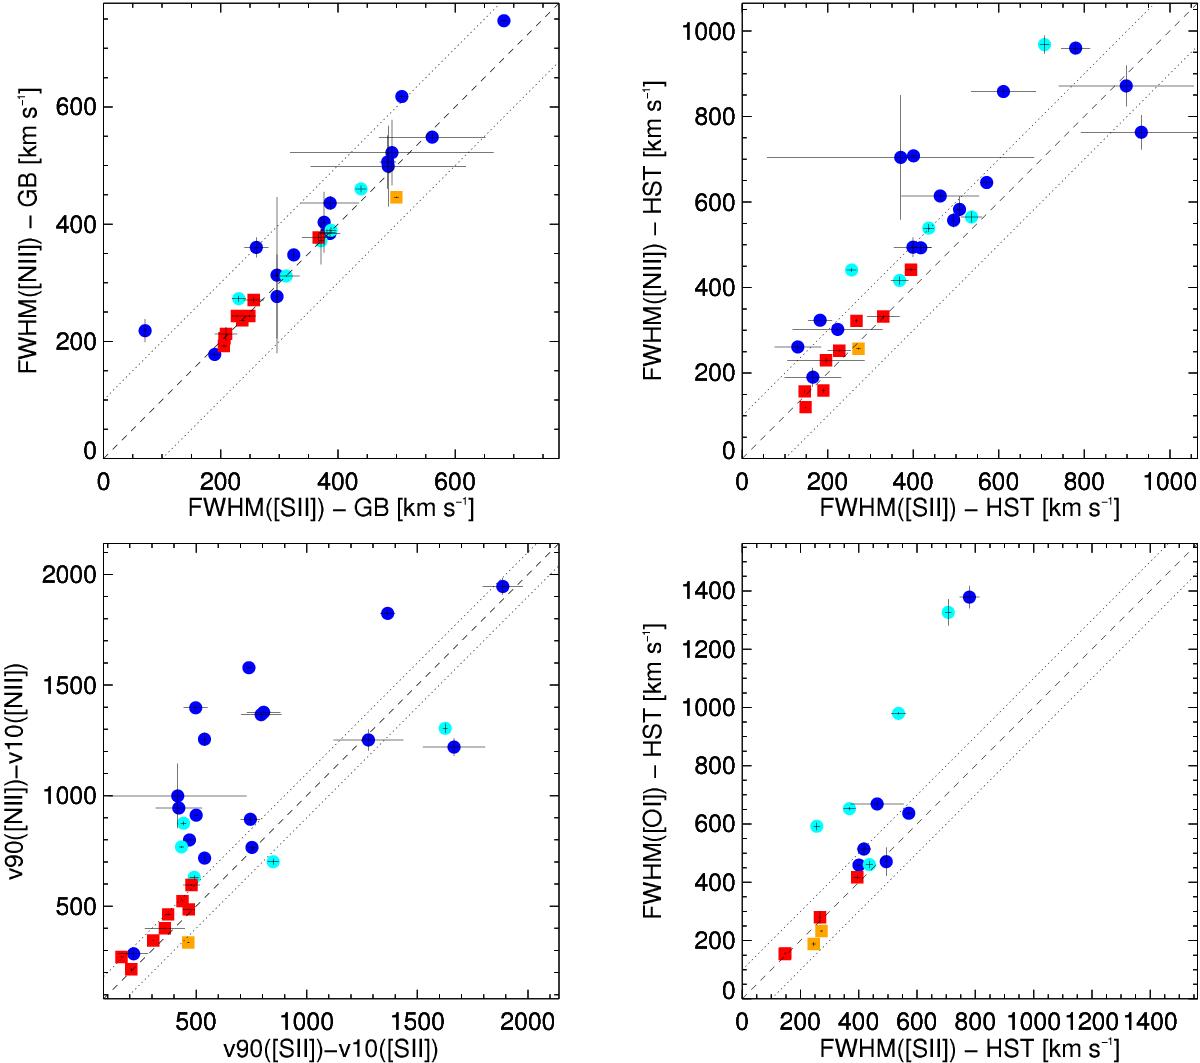
Comparison of the FWHM of the [ N II ] and [ S II ] emission lines from Palomar (top left) and HST (top right) spectra. NGC 4486 falls outside the plotting range. In the bottom left panel, we used the differences between the velocity defined at 10% and 90% of the total flux instead. In bottom right panel, we compare the FWHM of the [ O I ] and [ S II ] lines. Symbols as in Fig. 2.
Current usage metrics show cumulative count of Article Views (full-text article views including HTML views, PDF and ePub downloads, according to the available data) and Abstracts Views on Vision4Press platform.
Data correspond to usage on the plateform after 2015. The current usage metrics is available 48-96 hours after online publication and is updated daily on week days.
Initial download of the metrics may take a while.