Free Access
Fig. 2
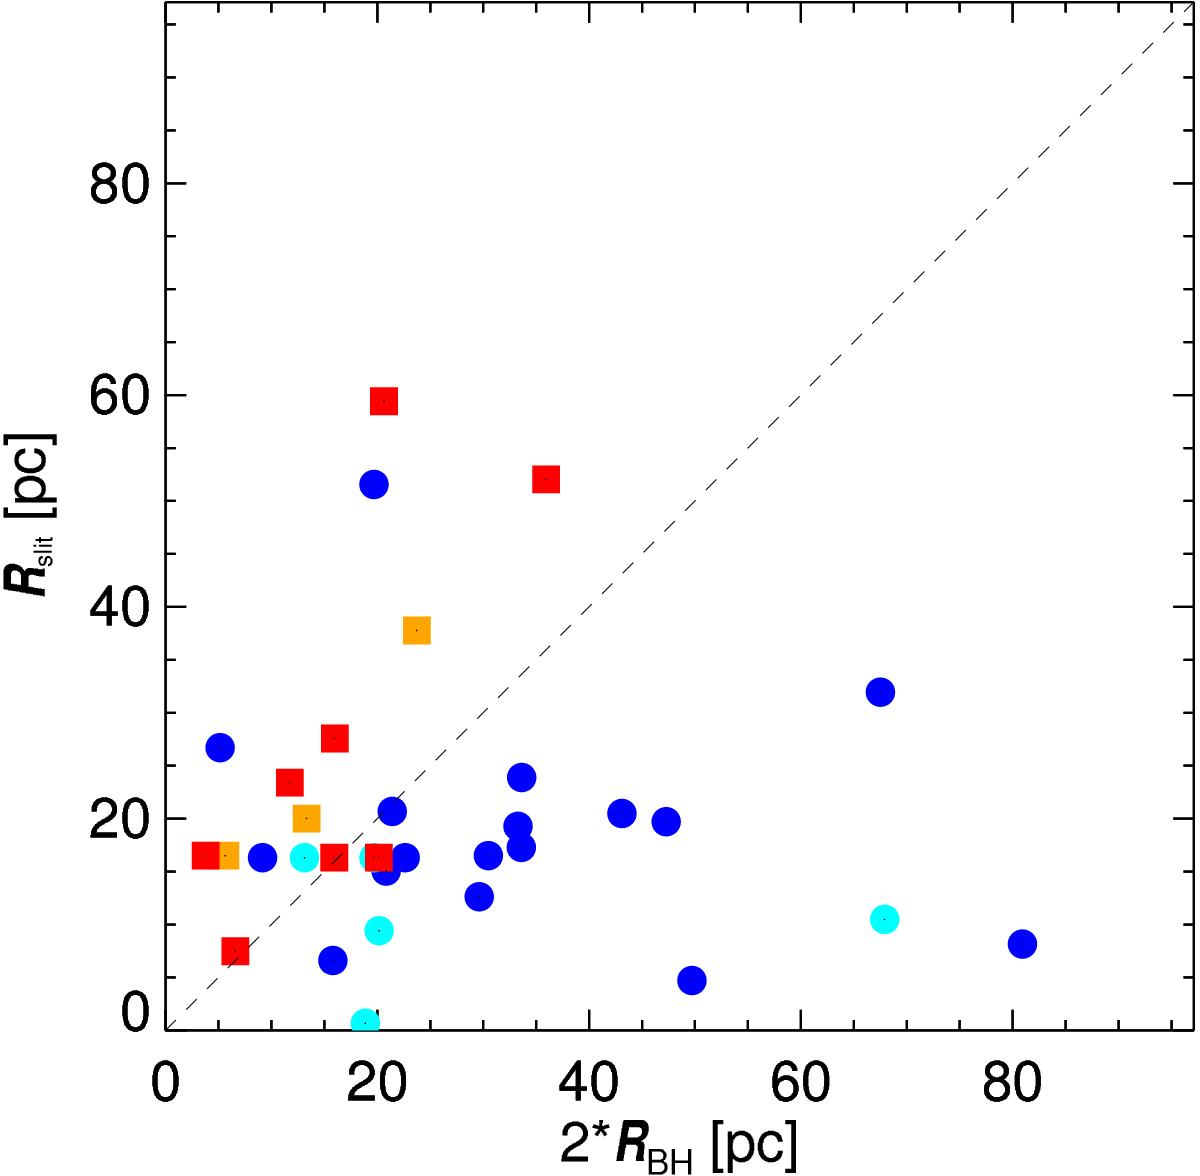
Projected size of the region covered by the HST slit versus the diameter of the black hole sphere of influence (both in parsec). Red squares represent Seyferts2, orange squares Seyferts1, blue dots LINERs2, and cyan dots LINERs1.
Current usage metrics show cumulative count of Article Views (full-text article views including HTML views, PDF and ePub downloads, according to the available data) and Abstracts Views on Vision4Press platform.
Data correspond to usage on the plateform after 2015. The current usage metrics is available 48-96 hours after online publication and is updated daily on week days.
Initial download of the metrics may take a while.