Fig. 3
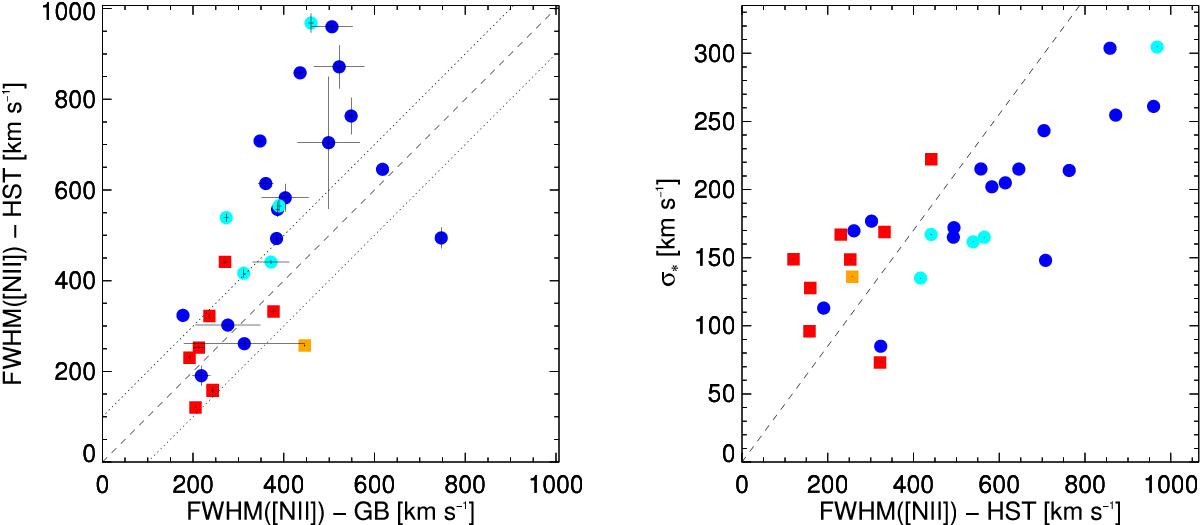
Left panel: comparison of the FWHM of [ N II ] emission line from HST and Palomar spectra. The dashed line is the bisectrix of the plane and the dotted lines enclose a region of ±100 km s-1 centered on the bisectrix. Symbols as in Fig. 2. NGC 4486 falls outside the plotting range. Right panel: stellar velocity dispersion in km s-1versus the FWHM of the [ N II ] emission line. The dashed line corresponds to FWHM[ N II ] = 2.35 × σ⋆.
Current usage metrics show cumulative count of Article Views (full-text article views including HTML views, PDF and ePub downloads, according to the available data) and Abstracts Views on Vision4Press platform.
Data correspond to usage on the plateform after 2015. The current usage metrics is available 48-96 hours after online publication and is updated daily on week days.
Initial download of the metrics may take a while.