| Issue |
A&A
Volume 586, February 2016
|
|
|---|---|---|
| Article Number | A152 | |
| Number of page(s) | 28 | |
| Section | Extragalactic astronomy | |
| DOI | https://doi.org/10.1051/0004-6361/201526872 | |
| Published online | 10 February 2016 | |
Kinematic signatures of AGN feedback in moderately powerful radio galaxies at z ~ 2 observed with SINFONI⋆
1 Institut d’Astrophysique Spatiale, CNRS, Centre Universitaire d’OrsayBat. 120−121 91405 Orsay France
e-mail: This email address is being protected from spambots. You need JavaScript enabled to view it.
2 European Southern Observatory, Karl-Schwarzschild Strasse, Garching bei München, Germany
3 Institut d’Astrophysique de Paris, CNRS & Université Pierre et Marie Curie, 98bis, bd Arago, 75014 Paris, France
4 SUPA, Institute for Astronomy, Royal Observatory of Edinburgh, Blackford Hill, Edinburgh EH9 3HJ, UK
5 Sydney Institute for Astronomy (SIfA), School of Physics, The University of Sydney, NSW 2006, Australia
6 Australian Astronomical Observatory, PO Box 915, North Ryde, NSW1670, Australia
7 ARC Centre of Excellence for All-sky Astrophysics (CAASTRO), Australia
8 Laboratoire AIM Paris-Saclay, CEA/DSM/Irfu, Orme des Merisiers, Bât. 709, 91191 Gif-sur-Yvette, France
Received: 1 July 2015
Accepted: 19 August 2015
Abstract
Most successful galaxy formation scenarios now postulate that the intense star formation in massive, high-redshift galaxies during their major growth period was truncated when powerful AGNs launched galaxy-wide outflows of gas that removed large parts of the interstellar medium. SINFONI imaging spectroscopy of the most powerful radio galaxies at z ~ 2 show clear signatures of such winds, but are too rare to be good representatives of a generic phase in the evolution of all massive galaxies at high redshift. Here we present SINFONI imaging spectroscopy of the rest-frame optical emission-line gas in 12 radio galaxies at redshifts ~2. Our sample spans a range in radio power that is intermediate between the most powerful radio galaxies with known wind signatures at these redshifts and vigorous starburst galaxies, and are about two orders of magnitude more common than the most powerful radio galaxies. Thus, if AGN feedback is a generic phase of massive galaxy evolution for reasonable values of the AGN duty cycle, these are just the sources where AGN feedback should be most important. Our sources show a diverse set of gas kinematics ranging from regular velocity gradients with amplitudes of Δv = 200−400 km s-1 consistent with rotating disks to very irregular kinematics with multiple velocity jumps of a few 100 km s-1. Line widths are generally high, typically around FWHM = 800 km s-1, more similar to the more powerful high-z radio galaxies than mass-selected samples of massive high-z galaxies without bright AGNs, and consistent with the velocity range expected from recent hydrodynamic models. A broad Hα line in one target implies a black hole mass of a few 109 M⊙. Velocity offsets of putative satellite galaxies near a few targets suggest dynamical masses of a few 1011 M⊙ for our sources, akin to the most powerful high-z radio galaxies. Ionized gas masses are 1−2 orders of magnitude lower than in the most powerful radio galaxies, and the extinction in the gas is relatively low, up to AV ~ 2 mag. The ratio of line widths, σ, to bulk velocity, v, is so large that even the gas in galaxies with regular velocity fields is unlikely to be gravitationally bound. It is unclear, however, whether the large line widths are due to turbulence or unresolved, local outflows as are sometimes observed at low redshifts. We compare our sources with sets of radio galaxies at low and high redshift, finding that they may have more in common with gas-rich nearby radio galaxies with similar jet power than with the most powerful high-z radio galaxies. Comparison of the kinetic energy with the energy supply from the AGNs through jet and radiation pressure suggests that the radio source still plays a dominant role for feedback, consistent with low-redshift radio-loud quasars.
Key words: galaxies: active / galaxies: high-redshift / galaxies: star formation / galaxies: jets / galaxies: kinematics and dynamics / radio continuum: galaxies
Based on observations carried out with the Very Large Telescope of ESO under Program IDs 084.A−0324 and 085.A−0897, and at ATCA under Program ID C2604.
© ESO, 2016
1. Introduction
It is now widely accepted that the supermassive black holes residing in the vast majority of early-type galaxies and bulges (e.g., Yu & Tremaine 2002) can have a sizeable impact on the evolution of their host galaxies. Semi-analytic models require a strong source of energy to balance the overcooling of gas onto dark matter halos and to avoid a strong excess in baryonic mass and star formation in galaxies compared to observations. The discrepancy is strongest at the high-mass end of the galaxy mass function, which is dominated by early-type galaxies (e.g., Benson et al. 2003), whose mass and structural properties appear closely related to the mass of their central supermassive black hole (e.g., Tremaine et al. 2002).
Powerful active galactic nuclei (AGNs) release approximately the equivalent of the binding energy of a massive galaxy during their short activity period, either in the form of radiation, or through jets of relativistic particles, or both. They are thus in principle able to offset the excess cooling out to the highest galaxy masses (Silk & Rees 1998). If sufficiently large parts of this energy are deposited in the interstellar medium (ISM) of the host galaxy, they may drive winds (Di Matteo et al. 2005) or turbulence (Nesvadba et al. 2011a). The mechanisms that cause this, however, are still not very well understood. Even very basic questions, e.g., whether feedback is dominated by radio jets or the bolometric energy output of radiatively efficient accretion disks, are still heavily debated in the literature. There is clear observational evidence that jets can perturb the ISM strongly even at kpc distance from the nucleus, while the observational evidence for winds driven by quasar radiation over kpc scales is still mixed (e.g., Husemann et al. 2013; Liu et al. 2013; Cano-Díaz et al. 2012; Harrison et al. 2012). Hydrodynamic models of radio jets are now finding deposition rates of kinetic energy from the jet into the gas that are broadly consistent with observations (Wagner et al. 2012).
Following the most popular galaxy evolution models, AGN feedback should have been particularly important in the early evolution of massive galaxies at high redshift, where AGN-driven winds may have blown out the remaining gaseous reservoirs that fueled the main phase of galaxy growth, inhibiting extended periods of subsequent star formation from the residual gas. Whereas the jets of powerful radio galaxies in the local Universe are known to affect the gas locally within extended gas disks (“jet-cloud interactions”, e.g., Tadhunter et al. 1998; van Breugel et al. 1985), it was found only recently that outflows driven by the most powerful radio jets in the early universe at z ~ 2 can encompass very high gas masses, up to about 1010 M⊙ in the most powerful radio galaxies at high redshift (Nesvadba et al. 2006, 2008a). This is similar to the typical total gas masses in massive, intensely star-forming, high-redshift galaxies of a few 1010 M⊙ (e.g., Greve et al. 2005; Tacconi et al. 2008). This gas is strongly kinematically perturbed with full width at half maximum (FWHM) up to ~ 2000 km s-1 and high, abrupt velocity gradients of similar amplitude, consistent with the expected signatures of vigorous jet-driven winds.
Galaxies with extreme radio power at 1.4 GHz of up to P1.4 = few × 1029 W Hz-1 like those studied by Nesvadba et al. (2006, 2008a) are, however, very rare, which raises the question of the impact that AGNs may have on their host galaxies when their radio power is significantly lower. The present paper gives a first answer to this question. It is part of a systematic study of the warm ionized gas in 49 high-redshift radio galaxies at z ~ 2 with SINFONI, which span three decades in radio power and two decades in radio size. Our sources cover the lower half of the radio power of this sample, P1.4 = few × 1026−27 W Hz-1 at 1.4 GHz in the rest frame. Toward lower radio power, contamination from the non-thermal radio continuum of vigorous starbursts becomes increasingly important. The high-redshift radio luminosity function of Willott et al. (2001) and Gendre et al. (2010) suggests that such galaxies are factors of 100 more common than the very powerful radio sources, with co-moving number densities on the order of a few 10-7 Mpc-3, sufficient to represent a short, generic phase in the evolution of massive galaxies, as we will argue below in Sect. 9.
The organization of the paper is as follows. In Sect. 2 we present our sample and in Sect. 3 our SINFONI near-infrared (NIR) imaging spectroscopy and ATCA centimeter continuum observations, and the methods with which we reduced these data. In Sect. 4 we present our methods of analysis and the results for each individual target, before presenting the overall results drawn from our sample in Sect. 5. In Sect. 6 we discuss the AGN properties, and in Sect. 7 we use additional line emitters near our radio galaxies to estimate dynamical masses of our high-redshift radio galaxies (HzRGs). In Sect. 8 we compare our data with other classes of HzRGs before discussing the implications of our results for AGN feedback. We argue in Sect. 9 that sources similar to those studied here may well be a representative subset of massive high-redshift galaxies overall, seen in a short but important phase of their evolution, and we summarize our results in Sect. 10.
Throughout our analysis we adopt a flat cosmology with H0 = 70 km s-1 Mpc-1, ΩΛ = 0.7, and ΩM = 0.3.
2. Sample
Our sources have a radio power of a few 1027−28 W Hz-1 at 500 MHz in the rest frame, about 2 to 3 orders of magnitude fainter than the most powerful high-redshift radio galaxies known, which reach up to nearly 1 × 1030 W Hz-1 (Miley & De Breuck 2008,and references therein), but powerful enough to safely neglect contamination from intense star formation. For comparison, an intensely star-forming HyLIRG (hyper-luminous infrared galaxy) with far-infrared luminosity LFIR = 1 × 10¹³ L⊙ would produce a rest-frame 1.4 GHz radio power of 1025.0 W Hz-1, assuming a far-infrared-to-radio luminosity ratio of 2.0, as found for high-redshift submillimeter galaxies (e.g., Vlahakis et al. 2007; Seymour et al. 2009; Thomson et al. 2014), and a radio spectral index typical of star formation of α = −0.7 to −0.8. This is very similar to the steep spectral indices α ~ −1.0 that are characteristic of high-redshift radio galaxies, making it even more difficult to disentangle the contribution of AGNs and star formation to lower-power radio sources than those studied here. In spite of their faintness relative to other high-redshift radio galaxies, the radio power of fainter sources in this present study is nonetheless comparable to that of the most powerful radio galaxies known at low redshift (e.g., Tadhunter et al. 1993).
Our targets come from two different surveys. One is the southern sample of 234 distant radio galaxies of Broderick et al. (2007), Bryant et al. (2009a,b), and Johnston et al. (in prep.), which we refer to hereafter as the MRCR-SUMSS sample. The other is the sample of radio galaxies within the fields of the ESO imaging survey (EIS) by Best et al. (2003) and Brookes et al. (2006, 2008), which we call the “CENSORS” sample (“Combined EIS-NVSS Survey Of Radio Sources”).
The MRCR-SUMSS sources have steep radio spectral indices α408−843 ≤ −1.0 between 408 MHz and 843 MHz, and fluxes at 408 MHz S408 ≥ 200 mJy. From this catalogue, we selected 12 moderately low-power sources at z ≥ 2 with P1.4 = few × 1027 W Hz-1. They have radio sizes between ~2′′ and 24′′ at 1.4 GHz frequency, a typical range of radio sizes of powerful HzRG.
The six galaxies with the lowest radio power ( W Hz-1) come from the CENSORS survey. This catalogue of 150 radio galaxies results from cross-matching the ESO Imaging Survey (EIS) patch D with the NVSS radio survey (Best et al. 2003). Radio sources detected in the NVSS were re-observed at 1.4 GHz with the VLA in the BnA configuration at a spatial resolution of 3′′−4′′, compared to the initial spatial resolution of the NVSS of 45′′, which is complete down to 7.2 mJy. This made it possible to study the structure of the radio sources and to identify the most likely rest-frame optical counterparts of 102 sources. Optical spectroscopy provided redshifts of 81 sources (Brookes et al. 2008). Among these, we selected six sources with a radio power of a few × 1026 W Hz-1 and appropriate redshifts for ground-based NIR follow-up spectroscopy. Three have extended radio morphologies and three have compact, unresolved radio cores.
3. Observations and data reduction
3.1. Near-infrared imaging spectroscopy
We observed all MRCR-SUMSS galaxies with the NIR imaging spectrograph SINFONI (Eisenhauer et al. 2003) between late 2009 and early 2010 under program ID 084.A-0324 at the ESO Very Large Telescope. SINFONI observations of the CENSORS sources were carried out between late 2010 and early 2011 under program ID 086.B-0571. All data were taken in Service Mode under variable conditions.
SINFONI is an image slicer that operates between 1.1 μm and 2.4 μm. We used the seeing-limited mode with the largest available field of view of 8′′×8′′ and a pixel scale of 250 mas. All data were taken with the H + K grating which covers wavelengths between 1.45 μm and 2.4 μm at a spectral resolving power R ~ 1500 (~200 km s-1). We observed each MRCR-SUMSS galaxy for 180−230 min of on-source observing time (300−440 min for the CENSORS sources), split into individual observations of 5 min. Most of our galaxies are smaller than the field of view. We therefore adopted a dither pattern where the object is shifted between two opposite corners of the field of view, which allows us to use two subsequent frames for the sky subtraction and makes taking dedicated sky frames unnecessary. The spatial resolution of our data is limited by the size of the seeing disk, which is typically around 1.0′′ for both samples. The FWHM sizes of the point spread functions (PSFs) of individual targets are given in Table B.1. They are measured from a standard star observed at the end of each hour of data taking.
Data reduction relies on a combination of IRAF (Tody 1993) and our own custom IDL routines (e.g., Nesvadba et al. 2011b). All frames are dark-subtracted and flat-fielded. We then remove the curvature from the spectra in each slit and put them onto a common wavelength scale by using the bright night-sky lines superimposed on each frame, using only arc lamp spectra to set the absolute wavelength scale. We then sky subtract our data and rearrange them into three-dimensional data cubes, which are then combined. To account for the variability of the night sky we scale the total flux in each sky frame to the total flux in each object frame, after masking the target. We use the standard star observations to correct for telluric and instrumental effects and to set the absolute flux scale.
In this analysis, we discuss the optical emission-line properties of 8 of the 12 MRCR-SUMSS galaxies we observed. Two of the other four, NVSS J004136−345046 and NVSS J103615−321659, have continuum emission but no line emission at the redshifts previously measured in the rest-frame UV. Their redshifts are relatively high, z = 2.6, placing [OIII] and Hα at wavelengths outside the NIR atmospheric bands, where the atmospheric transmission is below 10%, and is strongly variable both in time and in wavelength. At the expected wavelength of Hα, the telluric thermal background is already a factor of ~10 greater than at 2.2 μm. A third source, NVSS J233034−330009, was found to coincide with a foreground star after our data had already been taken (Bryant et al. 2009b). The fourth source, NVSS J210626−314003 shows a strong misalignment between the radio source and the extended gas, and no gas along the radio jet axis, which is very different from the other galaxies presented here. This source has already been discussed by Collet et al. (2015), so we do not describe its characteristics in detail again, but we do include it in the overall discussion of the properties of our sources. For the CENSORS sources we focus our discussion on the three sources where we detected line emission at the redshifts previously measured in the rest-frame UV.
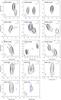 |
Fig. 1 Radio morphologies at 5.5 GHz of the MRCR-SUMSS sample. The size and orientation of the restored beam is given in the bottom left of each panel. The red box indicates the size and location of the SINFONI maps presented in Fig. 2. For NVSS J144932−385657, given the short observation time of this source and hence the deformed beam, we also present its 4.8 GHz observations from Bryant et al. (2009a), who observed a part of their sample at 4.8 GHz and 8.64 GHz. |
ATCA results.
3.2. Radio continuum observations
We observed our MRCR-SUMSS and CENSORS sources in two runs on 2012 January 28 and February 02 with the Australia Telescope Compact Array (ATCA, project C2604). Observations were carried out simultaneously at 5.5 and 9.0 GHz using the Compact Array Broadband Backend, with bandwidths of 2 GHz and channel widths of 1 MHz. The array configuration was 6A, with baselines between 337 and 5939 m. For flux density and bandpass calibration we observed PKS B1934−638 at the beginning and end of each session. Poor phase stability was due to heavy rain and high humidity, and this significantly affected the signal-to-noise ratio.
Individual sources were observed in 13–15 five-minute snapshots spread over 8.5 h to ensure good uv coverage; an exception was NVSS J144932−385657, which set early with only five snapshots spanning 3 h. We did not obtain any new data for CENSORS 072 because we used incorrect coordinates from Brooks et al. (2008). The ATCA observing log is given in Table B.2 and lists for each source the date of observation, total on-source integration time, the secondary phase calibrator used, and the synthesized beam at each frequency.
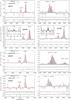 |
Fig. 2 Integrated spectra of our sources. Gaussian fits to detected lines are plotted as solid red lines. Below each spectrum we show a typical night-sky spectrum to illustrate the position of bright night-sky lines (dashed lines). This spectrum is not to scale; the night-sky lines shown are brighter than the emission lines from our targets. The bottom panel shows the fit residuals. |
Emission-line properties of the MRCR-SUMSS sources.
Emission-line properties of the Censors sources.
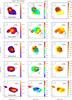 |
Fig. 3 Maps of [OIII] surface brightness (left), velocity (center), and FWHM line width (right) of our nine sources (from top to bottom). All maps are 4′′×4′′wide, except for NVSS J144932−385657 and NVSS J210626−314003, where they are 5′′×5′′wide. The circle in the bottom left represents the FWHM size of the seeing disk. Contours mark the continuum where detected. Continuum levels begin at 3σ and then increase in steps of 1σ. The solid black line in the velocity maps indicates the axis of the radio emission from our ATCA data, or from Broderick et al. (2007) if the source is compact. Numbers give half the largest angular size in arcsec. |
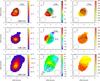 |
Fig. 4 Maps of [OIII] surface brightness (left), velocity (middle), and FWHM line width (right) of the three sources from the CENSORS sample. All maps are 4′′×4′′ on each side. The ellipse in the bottom corner shows the FWHM size of the seeing disk. Contours mark the stellar continuum emission, detected in the same datacube, beginning at the 3σ level and increasing by steps of 3σ. |
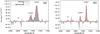 |
Fig. 5 Spectra extracted from the subregions of NVSS J002431−303330 shown in Fig. 2. a) Spectrum from the continuum region, with broad [OIII] lines (FWHM ~ 1150 km s-1). b) Spectrum of the quiescent gas, with much more narrow lines (FWHM ~ 450 km s-1). |
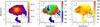 |
Fig. 6 Maps of NVSS J004000−303333 at SNR ≥ 3.0. A second emission-line region clearly appears ~2′′ to the south of NVSS J004000−303333, blueshifted by 350 ± 90 km s-1 relative to NVSS J004000−303333. |
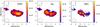 |
Fig. 7 Surface brightness maps of NVSS J144932−385657 at SNR ≥ 3.0 for the [OIII]λ5007, Hα, and [NII]λ6583 emission lines. The contours in the left panel show the continuum and in the other panels the [OIII] emission-line morphology. |
 |
Fig. 8 Left to right: surface brightness maps of NVSS J210626−314003 of the [OIII], Hα, and [NII]. Lines with SNR ≥ 3.0 are shown. Contours in the central and right panel show the [OIII] morphology to facilitate orientation. |
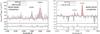 |
Fig. 9 Left: integrated spectrum of the southern part of the emission-line region of NVSS J004000−303333 that appears for SNR ≥ 3 and that is blueshifted at |
The data reduction was done with Miriad (Sault et al. 1995) in the standard way. We find typical beam sizes of 4′′×1.5′′ at 5.5 GHz and 2.5′′×0.9′′ with position angles between −6° and 13° (except for NVSS J144932−385657, where PA = −40°). Details are given in Table B.2.
The radio morphologies are shown in Fig. 1. They generally confirm those previously measured at 1.4 GHz and 2.4 GHz with larger beams. In NVSS J002431−303330 we detect a fainter second component to the southwest of the main radio emission below the detection threshold of previous observations. In NVSS J234235−384526 we tentatively detect a radio core that is coincident with the galaxy. Radio sizes are given in Table 1. The largest angular scale (LAS) gives the separation between the two lobes, if the source is resolved, or the deconvolved size, if it is not.
3.2.1. Relative astrometric alignment of the radio and SINFONI data
Studying the effects of the radio jet on the ISM of high-redshift galaxies requires an accurate relative alignment between the radio and NIR data sets to better than an arcsecond, i.e., better than the absolute astrometry of the VLT. Unfortunately, we did not detect the radio core of most of our galaxies with extended radio lobes. Moreover, owing to the small field of view of SINFONI, aligning our data cubes accurately within the World Coordinate System (WCS) is not trivial. We therefore register our cubes relative to the K-band imaging of Bryant et al. (2009a), which is accurately aligned with the WCS, and assume that the radio frame of ATCA aligns well with the WCS, to better than 1′′ (Broderick et al. 2007). For compact radio sources (LAS ≲ 2.0′′ in Table 1), we assume that the K-band continuum is aligned with the radio source, corresponding to the assumption that the radio emission in compact sources originates from the nucleus of the galaxy. Figure 1 shows the radio contours of the MRCR-SUMSS and CENSORS sources, and the red box gives the adopted position of the SINFONI maps based on this method.
4. Results
For each galaxy we show integrated spectra and emission-line maps of [OIII]λ5007 surface brightness, relative velocities, and FWHM line widths (Figs. 2 to A.2 and Tables 2 and 3). Unless stated otherwise, we give intrinsic FWHMs, FWHMintrinsic, that are corrected for instrumental resolution FWHMinst, setting  . The instrumental resolution, FWHMinst, is wavelength dependent and was measured from the width of night-sky lines. Maps are only given for spatial pixels where the signal-to-noise ratio of the line core exceeds 5. We used a Monte Carlo method to confirm that this was a good value with which to robustly measure the line properties in spite of strong non-Gaussianities in the noise related to the imperfect night-sky line subtraction, bad pixels, and potentially intrinsic line profiles.
Integrated spectra include all pixels where [OIII]λ5007 is detected at a significant level. We adopt the redshift estimated from the brightest pixels near the center of the galaxy as systemic. Before adding the spectrum of a pixel, we shift it to the systemic redshift in order to avoid artificial broadening of the line in the integrated spectrum by the large-scale velocity gradient.
For each galaxy we also mapped the surface brightness, relative velocity to the systemic redshift and the FWHM line widths of [OIII]λ5007 (Figs. 3 to 4) by fitting Gaussian profiles to the lines extracted from small apertures across the cube. Aperture sizes are 3 pixels × 3 pixels, corresponding to 0.4′′× 0.4′′, or 5 pixels × 5 pixels (0.6′′× 0.6′′) for the faintest regions of the source. This helps to improve the signal-to-noise ratio of the data, but still oversamples the seeing disk and avoids loss of spatial information. Since the sizes of the extended emission-line regions, Smaj,obs, are typically only a few times larger than the size of the seeing disk, we list sizes of semi-major and semi-minor axes that are corrected for the broadening of the PSF SPSF, Smaj,intrinsic, by setting 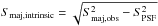 along the same position angle. The same method was applied to the size along the semi-minor axis, where resolved.
Contours in Fig. 3 show the line-free continuum emission for the galaxies where the continuum was detected. In most galaxies the continuum is only detected after collapsing the line-free cube along the wavelength axis. However, we detect relatively bright continuum emission in NVSS J002431−303330 and NVSS J201943−364542, which we need to subtract from the spectra before fitting the emission lines. To perform this subtraction, we mask strong emission lines and strong night-sky line residuals and fit a fifth-order polynomial over their whole spectrum, which we subtract afterward.
4.1. Description of individual sources
4.1.1. NVSS J002431−303330
NVSS J002431−303330 is a double radio source, dominated by a bright component associated with the optical counterpart, and a weaker component at 16′′ toward southwest (Fig. 1). We find this source at a redshift of z = 2.415 ± 0.001, which is in good agreement with the estimate of Johnston et al. (in prep.) from the rest-frame UV lines, with zuv = 2.416 ± 0.001. In the H band, we detect the [OIII]λ4959,5007 doublet and Hβ. In the K band, we find Hα and [NII]λ6548, 6583, which are strongly blended owing to their large intrinsic widths. The Hα line has a broad component with FWHM = 3250 km s-1. Figure 2 shows the integrated spectrum of this source. All line properties are listed in Table 2.
As shown in Fig. 3, NVSS J002431−303330 has a strong continuum associated with a bright emission-line region with [OIII]λ5007 surface brightness of (5−25) × 10-16 erg s-1 cm-2 arcsec-2. Line widths in this region are very broad, FWHM ~ 1200 km s-1, and the velocity field is perturbed with two small, unresolved regions that show abrupt velocity jumps relative to their surroundings with relative redshifts of about 250 km s-1 in each region. This area extends over ~1.0′′×1.0′′ around the peak of the continuum and [OIII]λ5007 line emission, corresponding to 8 kpc at z = 2.415. The Hα surface brightness in this region is ΣHα ~ (5−9) × 10-16 erg s-1 cm-2 arcsec-2.
Toward the southwest, the line emission becomes fainter, but can be traced out over another 2′′, with a typical [OIII]λ5007 surface brightness of Σ[OIII] = (1−5) × 10-16 erg s-1 cm-2 arcsec-2. The gas is more quiescent, with line widths of FWHM = 300−400 km s-1. We show integrated spectra of both regions in Fig. 5. The box in the right panel of Fig. 3 shows the region from which we extracted the narrow-line emission. This extended emission-line region to the southwest extends along the axis between the two radio lobes.
4.1.2. NVSS J004000−303333
NVSS J004000−303333 is a double radio source with a size of 17′′ (Fig. 1). With SINFONI we find the [OIII]λλ4959, 5007 doublet and Hβ in the K band at wavelengths that correspond to z = 3.399 ± 0.001. The Hα and [NII]λλ6548,6583 lines fall outside the atmospheric windows. In the H band, we detect the [OII]λ3727 doublet. The two lines of the doublet are too close to each other to be spectrally resolved with our data (Fig. 2). All line properties are listed in Table 2.
Line emission extends over 2.5′′×1.5′′ with surface brightnesses between Σ[Oiii] ~ 5 × 10-16 erg s-1 cm-2 arcsec-2 and 3 × 10-15 erg s-1 cm-2 arcsec-2 (Fig. 3). Faint continuum emission is found associated with a knot to the very east of the emission-line region, and about 1.5′′ southwest from the center, outside the bright line emission. The K-band image of Bryant et al. (2009a) shows a very similar continuum morphology, likewise at low signal-to-noise ratio.
The local velocities of [OIII]λ5007 fall monotonically from the southwest to the northeast with a total gradient of about 300 km s-1. The knot in the far east shows an abrupt velocity increase of 300 km s-1 relative to the nearby blueshifted gas. The line widths are lower in the north (FWHM = 200−400 km s-1) than in the south (FWHM = 700−1000 km s-1).
At fainter flux levels than shown in Fig. 3, but still above 3σ, we detect another source of line emission at a distance of about 2′′ to the south from the radio galaxy (about 15 kpc at z ~ 3). The redshift of this second source is zsouth = 3.395 ± 0.001, i.e., it is blueshifted by 350 ± 90 km s-1 relative to the radio galaxy. This source is shown in Fig. 6 and is discussed in Sect. 7.
4.1.3. NVSS J012932−385433
The SINFONI maps of NVSS J012932−385433 are shown in Fig. 3. We find the optical emission lines at redshift z = 2.185 ± 0.001. The radio source is compact with a deconvolved size of 0.7′′, and is associated with the optical counterpart.
[OIII]λλ4959, 5007 is bright in the H band. Hβ is detected at 5.6σ. In the K band, Hα and [NII]λλ6548, 6583 are detected and strongly blended. Hα also shows a broad component with FWHM ~ 3500 km s-1. The [SII] doublet is clearly detected. The two components are also strongly blended owing to their intrinsic width (Fig. 2). All line properties are listed in Table 2.
The emission-line region is extended over 1.6′′×1.2′′. It is brighter in the center with ΣHα ~ (1.0−1.7) × 10-15 erg s-1 cm-2 arcsec-2 and fades toward the periphery. We detect continuum emission coincident with the emitting gas. The [OIII]λ4959, 5007 lines show a clear, relatively regular velocity gradient of Δv ~ 350 km s-1 along a northeast-southwest axis. The lines are more narrow toward the southeast, with FWHM ~ 700−800 km s-1. In the northwest FWHMs are higher, ~900−1000 km s-1.
4.1.4. NVSS J030431−315308
NVSS J030431−315308 is a single, relatively compact source at 9 GHz and 5.5 GHz, with a deconvolved size of 1.8′′ in our highest resolution data at 9 GHz (Fig. 1). The [OIII]λλ4959, 5007 doublet is clearly detected in the H band with SINFONI and is well fitted with single Gaussians (Fig. 2). The same holds for the Hα and [NII]λλ6583 lines. The [SII] doublet is not detected. All line properties are listed in Table 2.
The line emission is marginally spatially resolved with a size of 1.5′′×1.5′′, and a PSF with FWHM = 1.2″ × 1.0″, the largest in this program (Table B.1). Faint continuum emission is also detected, at a slightly different position (~0.5′′ to the west) from the peak in [OIII]λ5007 surface brightness, but at the same position as the peak of Hα surface brightness. The velocity maps show two small redshifted (by 50−100 km s-1) regions north and south of the continuum, and uniform velocities in the rest of the source. Line widths are between 500 and 1200 km s-1 and higher in the western parts of the emission-line region associated with the continuum.
4.1.5. NVSS J144932−385657
NVSS J144932−385657 has one of the largest radio sources in our sample; the lobes are offset by 7.5′′ relative to each other. We find the [OIII] line at z = 2.149 ± 0.001. In the H band, we detect the [OIII]λλ4959, 5007 doublet and Hβ (Fig. A.1). In the K band, Hα and [NII]λ6583 are narrow enough not to be blended. FWHM = 350 km s-1 for Hα, and the width of [NII]λ6583 is dominated by the spectral resolution.
NVSS J144932−385657 has a very extended emission-line region of nearly 4′′ (~30 kpc at z ~ 2) along a northeast-southwest axis (Fig. 3). We identify two parts: a large, elongated region, which coincides with the continuum and extends over another 2′′ toward the southwest, and a fainter, smaller region in the northwest. Surface brightnesses of [OIII]λ5007 are between 1 × 10-16 erg s-1 cm-2 arcsec-2 and 10 × 10-16 erg s-1 cm-2 arcsec-2. The northwestern region is near the edge of the SINFONI data cube, and it is therefore possible that it extends farther beyond the field of view of our data. Both emission-line regions are aligned with the axis of the radio jet.
The velocity offset between the two regions is about 800 km s-1. While the compact northeastern part has a uniform velocity field with a redshift of about v ~ 400 km s-1, the kinematics in the very extended southwestern region are more complex with a maximum blueshift of about −400 km s-1, before the velocities approach the systemic redshift again at the largest radii. Line widths are FWHM = 200−500 km s-1 in the southwest, and up to 800 km s-1 in the northeast. In the southwestern region we find elevated widths in particular near the continuum and at about 1.5′′, a distance associated with the sudden velocity shift from −400 km s-1 to the systemic velocity.
In Fig. 7, we compare the surface brightness maps of Hα and [NII]λ6583, obtained by fitting three Gaussians corresponding to Hα, [NII]λ6548, and [NII]λ6583 with the velocities and line widths measured from [OIII]λ5007, and leaving the line flux as a free parameter. The map highlights the similarity of the Hα and [NII]λ6583 morphologies, which justifies our assumption that the Balmer and the optical forbidden lines originate from the same gas, at least at the spatial resolution of our data.
4.1.6. NVSS J201943−364542
The radio source of NVSS J201943−364542 is very extended, with LAS = 14.7′′, corresponding to ~120 kpc at z = 2.1 (Fig. 1). In the H band with SINFONI, we detect the [OIII]λλ4959, 5007 doublet at a redshift of z = 2.120 ± 0.001, but not Hβ. In the K band, in addition to the narrow components of Hα and [NII]λ6583, we find a broad Hα emission line (FWHM ≥ 8000 km s-1) from a compact region aligned with the nucleus. We come back to this line in Sect. 7. Integrated line properties are listed in Table 2.
NVSS J201943−364542 has a compact emission-line region of 1.0′′ with an [OIII]λ5007 surface brightness Σ[Oiii] = (0.5−1.0) × 10-15 erg s-1 cm-2 arcsec-2 (Fig. A.3). It also has relatively bright continuum emission associated with the line emission. The velocity field of the narrow-line component shows a scatter of ≤200 km s-1, with the highest velocities reached in the far east and west. The line widths are up to 800 km s-1.
At about 3′′ to the southeast we marginally detect another compact line emitter at a very similar redshift zsouth = 2.116 ± 0.001 (Fig. 9). The proximity on the sky and in redshift suggests that both sources are physically related with the radio galaxy. We will discuss this source in more detail in Sect. 7.
4.1.7. NVSS J204601−335656
NVSS J204601−335656 has a compact radio source with a deconvolved size of 1.8′′ in our data, consistent with the 1.6′′ previously found by Broderick et al. (2007). With SINFONI in the H band, we detect the [OIII]λλ4959, 5007 doublet and Hβ at z = 2.499 ± 0.001. In the K band, Hα and the [NII]λλ6548, 6583 doublet are blended but well fitted with a single Gaussian component for each line (Fig. A.1). The [SII] λλ6716, 6731 doublet is not detected. Table 2 summarizes the line properties of NVSS J204601−335656.
The line emission is marginally spatially resolved with a FWHM size of 1′′ compared to a 0.7′′×0.6′′ PSF. The emission-line region is associated with a faint continuum source; the region is roughly circular and extends over 1.0′′, with Σ[OIII] = (0.3−1.7) × 10-15 erg s-1 cm-2 arcsec-2.
NVSS J204601−335656 has a small velocity offset of 150 km s-1 which rises from northeast to southwest. Typical line widths are FWHM = 900−1200 km s-1.
4.1.8. NVSS J234235−384526
NVSS J234235−384526 is an extended radio source with two lobes at a relative distance of 9.8′′ (Fig. 1, see also Broderick et al. 2007). It is at redshift z = 3.515 ± 0.001, where the [OIII]λλ4959, 5007 doublet and the Hβ emission lines fall into the K band. Fitting the [OIII]λλ4959, 5007 line profiles adequately requires two components per line (Fig. 2), a narrow component with FWHM = 360 km s-1 (which we consider to be at the systemic redshift), and a broader blue wing with FWHM = 1300 km s-1, blueshifted by 700 km s-1. In the H band, we detect the [OII]λ3727 emission lines. Line properties are listed in Table 2.
Line emission extends over 2.0′′×1.0′′ along an axis going from northeast to southwest, with surface brightness Σ[Oiii] = (5−30) × 10-16 erg s-1 cm-2 arcsec-2 (Fig. A.3). The velocity map shows a gradient of about 400 km s-1 rising from the northeast to the southwest, and well aligned with the axis of the radio source. Line widths are larger in the center of the galaxy (FWHM ≃ 1000−1200 km s-1) than in the periphery (FWHM ≃ 200−400 km s-1). We do not detect any continuum emission.
4.2. CENSORS sample
4.2.1. NVSS J094949−211508 (CEN 072)
This source has a redshift of z = 2.427 ± 0.001, in agreement with the previous UV redshift measured by Brookes et al. (2008). Because there was a coordinate mismatch, we do not have new radio measurements at 5.5 and 9.0 GHz for this source. Best et al. (2003) found LAS < 0.7′′, which is small enough to infer that the extended emission-line region is larger than the radio emission.
The integrated spectrum shown in Fig. A.2 shows that [OIII]λλ4959, 5007 and Hβ are well detected in the H band, and Hα and [NII]λλ6548, 6583 in the K band, The lines are not very strongly blended. [SII]λλ6716, 6731 and [OI]λ6300 are not detected.
Line emission extends over 1.7′′×1.2′′ (14 kpc×10 kpc) along a northwest-southeast axis (Fig. 4). It has a velocity gradient of ~300 km s-1. The stellar continuum is associated with the northwestern part of the emission-line region, where the line widths also reach their maximum (FWHM ~ 800 km s-1), compared to FWHM ~ 300−500 km s-1 in the southeast.
4.2.2. NVSS J095226−200105 (CEN 129)
This source is at redshift z = 2.422 ± 0.001, in agreement with the previous estimate of z = 2.421 based on rest-frame UV lines (Brookes et al. 2008). The radio morphology is resolved in our ATCA observation at 5.5 and 9.0 GHz (see Fig. 1), but was compact in the previous 1.4 GHz data of Best et al. (2003). We find two radio lobes along an east-west axis along a position angle of 95°, separated by 2.5′′ (20 kpc at z = 2.4).
The integrated spectrum of CEN 129 shows Hβ and the [OIII]λλ4959, 5007 doublet in the H band, and Hα and the [NII]λλ6548, 6883 lines in the K band (Fig. A.2 and Table 3). The emission-line morphology of CEN 129 is fairly spherical, with a small extension toward the northwest, and a size of 2.3′′×1.7′′ (19 kpc×14 kpc). The major axis is along the northwest-southeast direction. The stellar continuum is detected at the center of the line emission. The velocity field has a gradient of ~200 km s-1, and is roughly aligned with the radio axis, along an east-west axis. The northwestern extension has the most blueshifted emission (−200 km s-1). Line widths are fairly uniform with FWHM ~ 600−700 km s-1.
4.2.3. NVSS J094949−213432 (CEN 134)
The integrated spectrum of CEN 134 shows Hβ and the [OIII]λλ4959, 5007 doublet in the H band, and Hα and [NII]λ6583 in the K band. We find a redshift of z = 2.355 ± 0.001 for CEN 134, in good agreement with the value estimated from rest-frame UV lines (Brookes et al. 2008). At 1.4 GHz, the radio source is very extended, with LAS = 22.4′′ along a position angle of 125° (Best et al. 2003). At 5.5 GHz we measure LAS = 21.9′′ and PA = 131°, but we do not detect the second lobe in the 9.0 GHz observations.
Line emission in CEN 134 extends over 3.1′′×1.8′′ (25 kpc×15 kpc), with the major axis going from the northwest to the southeast (Fig. 4). Continuum emission is detected in the southern part of the emission-line region. The velocity field shows two blueshifted regions, one south of the continuum, one at the very north of the emission-line region, with velocities of about −120 km s-1 relative to the velocities near the center. Line widths are higher in the south near the continuum position, with FWHM ~ 600 km s-1. In the north, the gas is more quiescent with FWHM ~ 300 km s-1.
5. Ensemble properties of the CENSORS and MRCR-SUMSS samples
After discussing each of our targets individually and in detail, we now turn to characterizing the overall properties of our sample. Although we do not have a complete sample in a strict statistical sense, this is a fairly common situation for studies of the spatially resolved properties of small to mid-sized samples of high-redshift galaxies (e.g., Förster Schreiber et al. 2006, 2009), and our sample size is comparable to most of these studies. It is also important to note that our study is a parameter study, not a population study. This means that we wish to analyze certain source properties as a function of the AGN characteristics of our sources. Therefore, we have to sample the range of AGN properties as uniformly as we can, and can put less emphasis on matching, e.g., the shape of the radio luminosity function. For this reason, we do not require a statistically complete sample in order to identify global trends in our data.
5.1. Rest-frame optical continuum
We detect rest-frame optical continuum emission in 12 sources, 9 from the MRCR-SUMSS, and 3 from the CENSORS sample. At redshifts z = 2−3, the observed H and K bands correspond roughly to the rest-frame V and R bands, and at redshifts z = 3−4 to the rest-frame B and V bands.
Since continuum fluxes in all sources are too faint to measure the detailed spectral profiles or even spectral slopes, we merely extract the spectrally integrated continuum image (Figs. 3 to 4). We generally find only one spatially unresolved continuum source per target at most, with one notable exception. In NVSS J004000−303333 we find two very faint unresolved continuum emitters of about equal flux, perhaps indicating an ongoing interaction of two galaxies, or AGN light scattered on extended dust (e.g., Hatch et al. 2009). Both blobs are roughly along the radio jet axis, somewhat reminiscent of the alignment effect found in more powerful HzRGs (Tadhunter et al. 1998; Vernet et al. 2001). In NVSS J234235−384526 we do not detect the continuum at all.
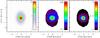 |
Fig. 10 Results of our toy models to estimate the impact of an unresolved, putative narrow-line region on our estimates of the extended gas kinematics. See Sect. 5.3 for details. Left: surface brightness map. Center: FWHMs of the cube with extended and narrow-line component. Right: relative increase in line widths between the cube with and without a narrow-line region. The red circles show radii corresponding to 1 and 1.5 times the size of the seeing disk. |
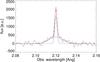 |
Fig. 11 Integrated spectrum of the artificial data cube shown in Fig. 10. The broad- and narrow-line components are clearly distinguishable, and the line profile is more reminiscent of bright quasars than the radio galaxies discussed here (see also Sect. 8.1). |
5.2. Morphology of the extended emission-line gas
Gas morphologies and kinematics are the two primary sets of constraints where the advantages of imaging spectrographs become particularly evident. Among our 12 targets, 10 are spatially resolved into a maximum of 10 elements along the major axis of the bright emission-line regions.
The emission-line morphologies and kinematics of our sources are very diverse. Isophotal sizes down to the 3σ detection limit of a few 10-17 erg s-1 cm-2 arcsec-1 range from about 5−6 kpc, corresponding to our resolution limit, to very extended sources where line emission is detected over at least 30 kpc (e.g., in NVSS J144932−385657), and potentially more because we cannot exclude in all cases (e.g., NVSS J144932−385657) that parts of the emission-line region fall outside the 8′′×8′′ field of view of SINFONI. Resolved emission-line regions are often elongated with ellipticities between 0.2 and 0.7. We do find a correlation between elongation and size, but cannot rule out that this is an artifact from the relatively low spatial resolution. Typical emission-line surface brightnesses are between a few 10-16 erg s-1 cm-2 arcsec-2 and a few 10-15 erg s-1 cm-2 arcsec-2 (Figs. 3 to 4).
Eight of our galaxies have spatially-resolved gas and a single rest-frame optical continuum peak. In those cases we can evaluate whether the line emission extends symmetrically about the nucleus based on the continuum peak being an approximation for the location of the central regions of the HzRGs (see Nesvadba et al. 2008a, for a justification). It is interesting that this is not always the case; in particular, we note a trend that the galaxies with the most regular velocity fields also appear to have gas that is well centered about the nucleus, as would be expected from a more dynamically relaxed system. While lopsidedness does exist even in isolated low-z galaxies, it would need to reach extreme levels to be seen at a resolution of 5 kpc and more. In NVSS J004000−303333, the source with the two equally faint continuum emitters, most of the gas is between the two continuum sources. This may somewhat favor the interpretation that the continuum is from two regions of scattered light rather than a merging galaxy pair, in which case we would expect at least some line emission to be associated with the nuclear regions of each interacting galaxy.
5.3. Blending of circumnuclear and extended emission
A potential worry for our morphological study is that unresolved circumnuclear emisson might be bright enough to dominate the emission-line maps even beyond the central PSF. Even very compact (≤1 kpc) emission-line regions akin to classical narrow-line regions (NLRs), if bright enough, could bias our measurements. In radio galaxies, where the direct view into the circumnuclear regions is obscured, this may be less important than in quasars, but since some of our sources do show a prominent nucleus, a more quantitative analysis is in order.
We constructed a suite of toy data cubes with and without a bright NLR embedded in extended, fainter gas with more quiescent kinematics. The NLRs were approximated by a bright point source, the extended line emission by a region of uniform surface brightness, with sizes, spatial and spectral sampling, and a spatial resolution comparable to our data (Fig. 10). Both components have Gaussian line profiles with FWHM = 300 km s-1 in the extended emission and FWHM = 800 km s-1 for the circumnuclear gas. These widths were derived from the final fitted data cube. The extended component has a velocity gradient of 400 km s-1 over the full source diameter. The signal-to-noise ratios in the final data cubes are comparable to our data, and for simplicity we assumed Gaussian noise. The beam smearing due to the seeing was approximated by convolving the data cube with a two-dimensional Gaussian in each wavelength plane.
For cubes with a dynamic range of at least 10 in gas surface brightness between nuclear point source and extended emission in the fitted data, we find an apparent increase in line width of 30−50% at a distance of 1× the PSF from the nucleus due to the NLR, and of 10−20% at 1.5× that radius (Fig. 10); 10−20% corresponds to our measurement uncertainties. The NLR component in these galaxies is easily seen in the integrated spectrum (Fig. 11).
However, only one galaxy (NVSS J144932−385657) has a dynamic range as high as 10. In most cases, the nucleus is only about 4−6 times brighter than the faintest extended emission (Fig. 3 to 4). Such a contrast is not sufficient to produce the observed strong increase in FWHM from 300 to 800 km s-1. The integrated line flux scales linearly with line core and FWHM. Because of the line broadening, an increase in surface brightness of a factor of 2.5−3 is therefore already implied by the line broadening, and the core of the broader component does not make a large contribution to the core of the measured line profile in the combined spectrum of circumnuclear and extended component. At SNR 5−10, the line wings of the circumnuclear component are hidden in the noise.
The broadening is stronger if the extended line emission is distributed asymmetrically about the nucleus, as is the case for CEN-134. For example, if we truncate the extended emission prior to the smoothing with the seeing disk at 1 times the FWHM of the PSF from the nucleus on one side, the central line width increases by a factor of 2 compared to the symmetric case. However, the circumnuclear spectral component then becomes even more prominent in the integrated spectrum. For an extended component that extends out to at least 1.5 times the FWHM size of the PSF, the difference very rapidly becomes indistinguishable.
This shows that our objects are not comparable to low-redshift Seyfert galaxies, for example, where a systemic and a narrow-line region, often with very different properties, can clearly be distinguished. The gas producing the relatively broad emission lines must extend over larger radii, even if these regions are not clearly resolved at the 5−8 kpc resolution of our data.
Emission-line imaging: observational parameters and results.
5.4. Kinematics
Our sample shows a wide variety of kinematic properties. Velocity fields range from very regular – dominated by a single, smooth, large-scale velocity gradient – to very irregular. The total velocity gradients are typically on the order of v = 200−300 km s-1. Given that the spatial resolution of our data is not very high for many of our sources, this gradient may appear lower than the intrinsic velocity gradient owing to beam-smearing effects. We used a set of Monte Carlo simulations to estimate that beam-smearing may lower the measured velocity gradients by about a factor of 2, comparable to inclination (Collet 2014). Overall, the line widths in our galaxies are relatively broad, FWHM = 400−1000 km s-1, down to the spatial resolution limit of our data. This is more than can be attributed to the overall velocity shifts and beam smearing.
Visual inspection of Figs. 3 to 4 shows that at most two galaxies, NVSS J012932−385433 and CEN 072, have regular velocity gradients without very obvious perturbations. All the other galaxies have significantly perturbed velocity fields. Even the very regular galaxy NVSS J012932−385433 may have slight irregularities in the blueshifted gas in a small region of the southwestern hemisphere, which is strongly blurred by the size of the seeing disk (Fig. 3). However, both galaxies have irregular distributions of line widths, which are at variance with quiescent disk rotation.
A good example for a galaxy with an irregular velocity field is CEN 134 (Fig. 4). This galaxy, and others with irregular velocity fields, exhibits sudden velocity jumps at least in parts of the emission-line region, and at signal-to-noise levels where this irregularity must be intrinsic to our sources over regions consistent with at least the size of the seeing disk (which is oversampled in the seeing-limited SINFONI mode, with 4−6 pixels per FWHM of the PSF). This would not be the case for simple noise features. It is interesting that these velocity jumps often coincide with the position of the continuum where we would expect the galaxy nucleus, and hence the AGN. They are also associated with a local broadening of the emission lines, but are not large enough to be the sole cause of this broadening. We will come back to the interpretation of these kinematic properties in Sect. 8.
5.5. Extinction
The extended gas of powerful HzRGs is often very dusty, causing several magnitudes of extinction in the rest-frame V band (Nesvadba et al. 2008a). We measure the Hα/Hβ decrement to estimate the extinction in the warm ionized gas of our sources, assuming an intrinsic Balmer decrement of Hα/Hβ = 2.9 and adopting the galactic extinction law of Cardelli et al. (1989). We detect Hα in all seven galaxies where it falls into the atmospheric windows. For NVSS J004000−303333 and NVSS J234235−384526, which are at z ≳ 3.5, we cannot observe Hα from the ground. Hβ is detected in eight of the nine integrated spectra of the galaxies of our sample, and six galaxies have both lines in common. For NVSS J201943−364542, we can only set an upper limit to the Hβ flux and, consequently, we give lower limits to the extinction. We find typical extinctions between formally AHβ = 0 mag in four galaxies, and up to AHβ = 1.9 mag, where AHβ = AV−0.14 mag. Results for individual sources are listed in Table 5.
5.6. Electron densities
The ratio of the lines in the [SII]λλ6716, 6731 doublet is density-sensitive over large ranges in density from about 100 cm-3 to 105 cm-3 and can be used to estimate the electron density in the emission-line gas (Osterbrock 1989). These lines are well detected in two galaxies, NVSS J012932−385433, where they are broad and blended, and in NVSS J210626−314003 (see Figs. 2 and A.1). We find ne = 750 cm-3 for NVSS J012932−385433 and ne = 500 cm-3 for NVSS J210626−314003, assuming a temperature T = 104 K.
Electron densities of 500−700 cm-3 are higher by factors of a few than those in low-redshift AGNs with powerful radio sources and electron densities of a few 10 to about 100 cm-3 (e.g., Stockton 1976). This mirrors the higher electron densities of a few 100 cm-3 in the interstellar gas of star-forming galaxies at z ~ 2 (Le Tiran et al. 2011) compared to starburst galaxies in the nearby Universe, and it also explains the higher surface brightnesses of extended gas in our galaxies compared to low-z AGN hosts. Similar electron densities of a few 100 cm-3 have previously been found in other HzRGs (e.g., Nesvadba et al. 2006, 2008a, in prep.; Humphrey et al. 2008), but we caution nonetheless that the value we adopt here is uncertain by factors of a few. We adopt a fiducial value of ne = 500 cm-3 for the other galaxies in our sample, which corresponds to the average of HzRGs with appropriate measurements.
5.7. Ionized gas masses
Estimating the mass of warm ionized gas in high-redshift galaxies is straightforward, and can be done by measuring the flux of the bright Balmer lines and the electron density in the gas. The basic principle of the measurement is to count the number of recombining photons at a given electron density. Assuming case B recombination, we can estimate the ionized gas mass following Osterbrock (1989) by setting 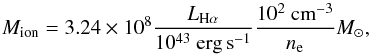 (1)where LHα is the Hα luminosity corrected for extinction and ne is the electron density.
We find masses of ionized gas in our sample in the range 1−10 × 108 M⊙ when using extinction-corrected luminosities, and in the range 0.5−5 × 10⁸ M⊙ when using the observed luminosities of Hα without taking extinction into account. This is generally less than in previous studies of more powerful radio galaxies (e.g., Nesvadba et al. 2006, 2008a, in prep.), which have masses of warm ionized gas between 109 and a few × 1010 M⊙.
Integrated line properties and related estimates.
Kinetic energy of the jet and gas.
6. Properties of AGNs and black holes
6.1. Centimeter radio continuum
Our sources cover a range of radio sizes and morphologies, ranging from single compact sources of the size of the ATCA beam (typically 1′′−3′′ at the highest observed frequency of 9 GHz) and single compact sources that potentially have faint extended structures to doubles with sizes of up to 25′′. Only in one case do we potentially detect the radio core along with the lobes. This spatial resolution is lower than can be achieved with the JVLA at the highest resolution, but most of our targets are too far south to be observed with the JVLA with a good, symmetric beam. Nonetheless, the resolution of these data is sufficient to distinguish between radio sources that have and have not yet broken out of the ISM of the host galaxy (i.e., sources with sizes below or above approximately 10 kpc), which is the most important distinction for our purposes.
We use our observed radio fluxes, previous ATCA results from Broderick et al. (2007) and Bryant et al. (2009b), and the NVSS results from Brookes et al. (2008) to constrain the radio power at different frequencies, the radio spectral index, and the kinetic energy of the radio lobes. In Table 1 we list the radio power of each source at a rest-frame frequency of 1.4 GHz, which is frequently given in the literature for high-redshift quasars (e.g., Harrison et al. 2012) and at 500 MHz in the rest-frame, which is the reference frequency of the sample of powerful radio galaxies at z ~ 2 in the compilation of Miley & De Breuck (2008).
With a rest-frame radio power at 1.4 GHz between 3 × 1026 W Hz-1 and 8 × 1027 W Hz-1 (8 × 1026 W Hz-1 to 3 × 1028 W Hz-1 at 500 MHz, Table 1), our sources are intermediate between typical dusty starburst galaxies and the most powerful radio galaxies at similar redshifts. To calculate radio spectral indices, we used our own measurements at 5.5 GHz and 9.0 GHz, 1.4 GHz observations from the NVSS catalog, and for the MRCR-SUMSS sample the Broderick et al. (2007) results at 0.408 GHz, 0.843 GHz, and 2.368 GHz. Spectral indices are estimated from best fits to the power law of the radio spectral energy distribution, giving values between α = −0.8 and −1.4, without clear evidence of spectral breaks. Table 1 lists the results for each individual source. For the MRCR-SUMSS sample, our results agree with those of Broderick et al. (2007). For the CENSORS sample, no previous measurements of the radio spectral index were available.
We use the measured radio fluxes and spectral indices to extrapolate the radio power down to the rest-frame frequencies for which empirical calibrations of the kinetic energy of the radio source have been derived. The observed jet power is only a small fraction (≤1%) of the mechanical power of the radio jet. Specifically, we use the relationship of Willott et al. (1999) which is based on the 151 MHz flux in the rest frame (and given in units of 1028 W Hz-1 sr-1), L151,28, and set  , where f represents the astrophysical uncertainties and is typically between 1 and 20. Here, we use f = 10 (see also Cattaneo et al. 2009).
We also use the calibration of Cavagnolo et al. (2010) which measures the work needed to inflate the X-ray cavities found in low-redshift galaxy clusters as a proxy to the mechanical power of the radio jet, log Pcav = 0.75( ± 0.14)log (P1.4 + 1.91( ± 0.18)), where Pcav is the kinetic power of the X-ray cavity given in units of 1042 erg s-1, and P1.4 the radio power at 1.4 GHz in the rest frame. Both approaches give broadly similar results with differences of typically about 0.1 dex for the MRCR-SUMSS sources, and differences of 0.3 dex for the CENSORS sources, which have steeper spectral indices. We list all results in Table 1.
6.2. Bolometric AGN emission
For a first estimate we consider the [OIII]λ5007 luminosity (Table 5) as a signature of the nuclear activity in our galaxies. Even if we neglect extinction, our measured [OIII]λ5007 line fluxes indicate luminosities in the range of 0.1−few × 1044 erg s-1, in the range of powerful quasars and only somewhat fainter than the [OIII]λ5007 luminosities of the most powerful HzRGs. As discussed in more detail in Nesvadba et al. (in prep.), the line ratios in our galaxies are also consistent with being photoionized by their powerful AGNs. Correcting the fluxes for extinction, which is relatively low in our targets (see Sect. 5.5), increases these values by factors of a few. Using the relationship of Heckman et al. (2004), this would correspond to bolometric luminosities of the AGNs on the order of ℒbol = 3500 × ℒ([OIII]) or a few 1046−47 erg s-1. Although this estimate is known to overestimate the intrinsic bolometric luminosities of radio-loud quasars by factors of up to a few, this does not change the result at an order-of-magnitude level as we are stating here.
6.3. Broad-line components and properties of black holes
Constraining the AGN properties of high-z radio galaxies is notoriously difficult since it is the very nature of radio galaxies that the direct line of sight into the nucleus is obscured. However, in a few fortuitous cases (e.g., Nesvadba et al. 2011b), broad Hα lines have been observed that are likely to trace the gas kinematics within a few light-days from the supermassive black hole (Kaspi et al. 2000; Peterson et al. 2004). Such lines can be used to constrain the mass of the black hole and its accretion rate (e.g., Greene & Ho 2005).
As described in Sect. 4, we fitted the spectra of our sources with single Gaussian components. Within the uncertainties of our data this yields acceptable fits to the integrated spectra of most targets and for most emission lines. However, three of our targets, NVSS J002431−303330, NVSS J012932−385433, and NVSS J201943−364542, require additional Hα components. These components have FWHM ≥ 3000 km s-1, significantly broader than the systemic line emission. Moreover, NVSS J234235−384526 clearly shows a second [OIII]λ5007 component. Fainter, marginally detected broad [OIII]λ5007 components may also be present in NVSS J002431−303330 and NVSS J004000−303333.
The origin of broad (FWHM ≫ 1000 km s-1) Hα line emission at high redshift has either been attributed to winds driven by starbursts (e.g., Le Tiran et al. 2011; Shapiro et al. 2009; Nesvadba et al. 2007) or active galactic nuclei on galaxy-wide scales (e.g., Alexander et al. 2010; Nesvadba et al. 2011b; Harrison et al. 2012), or alternatively, to gas motions in the deep gravitational potential wells very near the supermassive black hole (e.g., Alexander et al. 2008; Coppin et al. 2008; Nesvadba et al. 2011b). For galaxies like NVSS J234235−384526, and perhaps NVSS J002431−303330 and NVSS J004000−303333, which only have relatively broad [OIII] components, it is clear that the broad-line emission probes gas in the narrow-line region or outside, at larger galactocentric radii. This is similar to high-z quasars (e.g., Harrison et al. 2012; Nesvadba et al. 2011c), since forbidden lines are collisionally de-excited at the high electron densities of the broad-line region (e.g., Sulentic et al. 2000). The non-detection of these components in the Balmer lines make it unlikely that these winds encompass large gas masses. High electron densities and ionization parameters can boost the luminosity of the [OIII]λλ4959, 5007 lines without implying large gas masses (e.g., Ferland 1993).
For galaxies where we only observe broad components in the Hα and [NII]λλ6548, 6583 complex, with widths that make it difficult to uniquely associate the broad-line emission with either line, the situation is less clear. Line widths of ≥3000 km s-1 have been considered as evidence of BLRs in submillimeter galaxies and quasars at z ~ 2 (Alexander et al. 2008; Coppin et al. 2008); however, extended emission lines with FWHM ~ 3500 km s-1 have been observed in very powerful radio galaxies at similar redshifts (e.g., Nesvadba et al. 2006), and given the generally large line widths in our sources, it is clear that the ISM is experiencing a phase of strong kinetic energy injection.
Among our sources, NVSS J201943−364542 clearly stands out in terms of line width and line luminosity. It is the only galaxy with a line as broad as (FWHM = 8250 km s-1) and as luminous as (ℒ = 1.1 × 1044 erg s-1) the Hα emission from nuclear broad-line regions in powerful radio galaxies at similar redshifts (Nesvadba et al. 2011b), and exceeds the “typical” bona fide AGN-driven wind by nearly an order of magnitude in line width. We do not find a broad component in [OIII] that would correspond to the one seen in Hα.
Following Greene & Ho (2005) we can use the width and the luminosity of the Hα line to estimate the mass and accretion rate of the supermassive black hole,  M⊙ and Lbol,AGN = 1.4 × 10¹²ℒ⊙ and ℒbol = 5.3 × 1045 erg s-1. The Eddington luminosity of a M⊙ black hole is ℒEdd = 2.8 × 1047 erg s-1, corresponding to an Eddington ratio of 2%. These values are well within the range found for more powerful radio galaxies at z ≥ 2 (Nesvadba et al. 2011b), including the remarkably low black hole Eddington ratio compared to many bright high-redshift quasars (see Nesvadba et al. 2011b, for a detailed discussion). We caution, however, that we did not take into account that the extinction might be greater than that of optically selected quasars. Our non-detection of Hβ implies A(Hβ) ≥ 1.7, which would be less than the AV = 3.5 mag used by Greene & Ho (2005), if taken at face value. If the unified model applies for these galaxies (Antonucci 1993; Drouart et al. 2012), then differences in inclination are likely the largest uncertainty of about a factor of 2, with little impact on our results. Drouart et al. (2014) find higher Eddington ratios from Herschel/SPIRE observations of five of the Nesvadba et al. (2011b) sources when adopting a bolometric correction factor of 6 between the far-infrared and bolometric luminosity of these galaxies. The measured far-infrared luminosities are lower by factors of up to 5 than the ℒbol derived from the Hα line luminosity.
The more moderate line widths (FWHM ≥ 3000 km s-1) and line luminosities of NVSS J002431−303330 and NVSS J012932−385433 make interpreting the nature of the broad-line components in these galaxies more difficult, and it is not possible with the present data alone to clearly distinguish between the wind and the black hole hypothesis. Under the assumption that these lines probe the AGN broad-line region, we find (using the same approach as above and using the measurements listed in Tables 2 and 3)  erg s-1 and
  erg s-1 for NVSS J012932-385433 and NVSS J002431−303330, respectively, and black hole masses of
  M⊙ and
  M⊙, respectively. The Eddington ratios would be as low as for NVSS J201943−364542, about 2−3%. We caution, however, that we have no unique constraint to distinguish between AGN broad-line emission, and gas interacting with the radio jet on larger scales in these two sources. If confirmed to be tracing BLR gas, these two galaxies would have supermassive black holes with masses closer to submillimeter galaxies than more powerful radio galaxies at z ~ 2, although their accretion rates would be significantly lower than in submillimeter galaxies (which accrete near the Eddington limit; Alexander et al. 2008). However, their kinetic jet power (5 × 1046 erg s-1 for both sources, using the approach of Cavagnolo et al. 2010), would slightly exceed their Eddington luminosities, LEdd = 3.6 and 3.1 × 1046 erg s-1, and their bolometric luminosities implied by Hα would be two orders of magnitude lower than those implied by their [OIII] luminosities. Although super-Eddington accretion is not impossible, it is very rarely observed, which is why we are doubtful that these are bona fide AGN broad-line regions.
7. Additional line emitters and dynamical mass estimates of our HzRGs
Many high-redshift radio galaxies do not exist in solitude. A large number of imaging and spectroscopic studies have demonstrated conclusively that many massive radio galaxies at z ≥ 2 are surrounded by galaxy overdensities at the same redshift, as well as significant reservoirs of molecular, atomic, and ionized gas, including diffuse intra-halo gas (Le Fèvre et al. 1996; Venemans et al. 2007; Hayashi et al. 2012; Galametz et al. 2012; van Ojik et al. 1997; Villar-Martín et al. 2003; De Breuck et al. 2003; Nesvadba et al. 2009; Wylezalek et al. 2013; Collet et al. 2015). With the small field of view of only 8′′×8′′, SINFONI can only constrain the very nearby environment of HzRGs out to a few tens of kpc (8′′ correspond to 64 kpc at z ~ 2); however, this small-scale environment is particularly interesting, e.g., to study how accretion and merging may affect the evolutionary state of the radio galaxy. Given the presence of extended gas clouds well outside the radio galaxy itself, which we attribute to AGN-driven winds and bubbles, it may not be immediately clear how to identify a secondary line emitter within a few tens of kpc from the radio galaxy as another galaxy in each individual case.
We have three such examples, NVSS J004000−303333, NVSS J201943−364542, and NVSS J144932−385657. For the last, we argue in Sect. 8.2 why we favor the interpretation of an AGN-driven bubble. For NVSS J004000−303333 and NVSS J201943−364542 the situation is more difficult. In either case, the line emission cannot be geometrically associated with the radio jet, which strongly disfavors a direct physical connection between jet and gas. The redshifts in both cases are significantly offset from those in the radio galaxy itself. In NVSS J201943−364542, the line widths of this second component are also very narrow, FWHM = 320 km s-1, and the light is emitted from within about 1′′ (8 kpc at z = 2.1), as would be expected from a low-mass galaxy in the halo of NVSS J201943−364542. The high [OIII]/Hβ ratios observed in this putative companion are consistent with the values observed in rest-frame UV selected, fairly low-mass galaxies such as Lyman-break galaxies (LBGs) and other blue, intensely star-forming galaxies at high redshifts. The [OIII]λ5007 luminosity of our source, ℒ = 5.3 × 1042 erg s-1, does not stand out compared to the LBGs of Pettini et al. (2001), for example, which typically have ℒ = a few × 1042 erg s-1.
In NVSS J004000−303333, the line emission is closer to the HzRG, within about 1′′, and brighter, ℒ([OIII]) = 4 × 1043 erg s-1. This may indicate that the gas is at least partially lit up by photons originating from the AGN in the radio galaxy. The proximity to the radio galaxy may also suggest that this gas is already dominated by the gravitational potential of the radio galaxy itself, either as part of a satellite galaxy that is being accreted (e.g., Ivison et al. 2008; Nesvadba et al. 2007), or perhaps because it is associated with an extended stellar halo forming around the HzRG, as observed in other cases (Hatch et al. 2009; see also Collet et al. 2015).
With both hypotheses, the projected velocity of these additional line emitters would be dominated by gravitational motion, and can therefore be used as an order-of-magnitude measure of the dynamical mass of the central radio galaxy and its underlying dark matter halo. Assuming that the system is approximately virialized, we set  , where the circular velocity, vc, is vc = vobs/ sini, and where R is the projected radius, and G the gravitational constant. With vobs = 408 km s-1 for the companion of NVSS J201943−364542, vobs = 350 km s-1 for NVSS J004000−303333, and projected distances of 24 kpc and 8 kpc, respectively, we find dynamical mass estimates of 9 × 10¹¹ sin-1i M⊙ for NVSS J004000−303333 and of 3 × 10¹¹ sin-1i M⊙ for NVSS J201943−364542, respectively. Both are in the range of stellar and dynamical masses estimated previously for the most powerful HzRGs (Seymour et al. 2007; De Breuck et al. 2010; Nesvadba et al. 2007; Villar-Martín et al. 2003).
8. Signatures of AGN feedback
8.1. Comparison with other massive high-z galaxies
Given the complexity of the gas kinematics of high-redshift galaxies and incomplete sets of observational constraints, the astrophysical mechanism that dominates the gas kinematics is not always easy to identify ab initio. It is therefore illustrative to compare our sources with sets of other massive, contemporary galaxy populations with imaging spectroscopy to highlight the peculiarities of our galaxies in an empirical way. Specifically, we compare our sample with the stellar-mass selected sample of Buitrago et al. (2014) of ten galaxies with Mstellar ≥ 1011 M⊙ at z ~ 1.4 without obvious AGN signatures, and with the submillimeter selected dusty starburst galaxies of Alaghband-Zadeh et al. (2012) and Menéndez-Delmestre et al. (2013) without very powerful AGN, and those of Harrison et al. (2012) and Alexander et al. (2010) with powerful obscured quasars.
The Buitrago et al. (2014) and starburst-dominated submillimeter galaxies (SMGs) generally have similar or even larger velocity gradients than our sources, and these gradients are often very regular with a monotonic rise from one side of the emission-line region to the other. Total velocity offsets are between 200 and 600 km s-1 in the Buitrago et al. (2014) sample, and between 100 and 600 km s-1 in the SMGs of Alaghband-Zadeh et al. (2012) and Menéndez-Delmestre et al. (2013). In this comparison we discard one galaxy of Alaghband-Zadeh et al. (2012) which shows AGN characteristics in the optical, but not in the far-infrared. The sizes of emission-line regions in both samples are between 1′′ and 3′′.
A significant difference between our HzRGs and the comparison samples are, however, the highest FWHMs in our sources, between 400 km s-1 and 1500 km s-1. FWHMs in the Buitrago et al. (2014) sample are 100−300 km s-1, and in the starburst-dominated SMGs they are between 160 and 470 km s-1. Even in the SMGs, where the gas kinematics may be severely affected by ongoing galaxy mergers, the line widths are significantly lower than in our galaxies.
Larger FWHMs than in the mass-selected and starburst-dominated sources are also found by Harrison et al. (2012, see also Alexander et al. 2010, who study the ionized gas kinematics in eight sub-mm selected starburst/AGN composites at z ~ 1.4−3.4 with imaging spectroscopy of [OIII]λ5007. Their galaxies are detected at 1.4 GHz with luminosities of 1024−25 W Hz-1, too low to disentangle the contribution of star formation and radio source. Bolometric luminosities of their obscured AGN are a few 1046−47 erg s-1, similar to powerful radio galaxies. They find FWHM = 200−1500 km s-1, not very different from our targets, and total velocity offsets of 100−800 km s-1.
However, their galaxies have integrated [OIII] line profiles that are very different from those in our sample. Where signal-to-noise ratios permit, their lines show a narrow component superimposed onto a broad line, often with widths well in excess of FWHM ~ 1000 km s-1. Similar [OIII] profiles were reported by Nesvadba et al. (2011c) and Cano-Díaz et al. (2012) for other obscured quasars at similar redshifts. In turn, our HzRGs have one, generally broad, line component with FWHM = 500−1000 km s-1. This suggests that significant parts of the gas in high-z quasar hosts are not strongly perturbed by the AGN. Nesvadba et al. (2011c) find that the broadest line widths are found in an unresolved region near the AGN, where [OIII] luminosities are likely boosted by high electron densities. Consistent with this finding, the quasars of Harrison et al. (2012) exhibit velocity curves that are fairly regular and flattened at low surface brightness, consistent with the turnover expected for rotation curves. Although our sources do have extended lower surface-brightness line emission with more quiescent kinematics, their contribution to the integrated line profile is smaller, and this gas is outside the region where a connection with the radio source is obvious (Villar-Martín et al. 2003). In quasars and Seyfert galaxies at low redshift, Husemann et al. (2013) and Müller-Sánchez et al. (2011) also find that the gas is only perturbed near the radio source, in broad agreement with our findings (but see Liu et al. 2013).
8.2. Outflows or disk rotation?
The large velocity offsets of up to 2500 km s-1 in the most powerful HzRGs make it relatively easy to conclude that the gas is driven by powerful, non-gravitational processes (Nesvadba et al. 2006, 2008a). In the sources we are studying here, the situation is not so clear. Although we do find total velocity offsets of a few 100 km s-1 in the six galaxies with resolved gas kinematics, in four cases they are relatively small, Δv = 300−450 km s-1, and, as we just discussed in Sect. 8.1, within the range found in massive early-type galaxies at high redshift without powerful AGNs. If we assume that this gas is in a rotating disk and derive a mass estimate from the virial theorem (Sect. 7), this corresponds to masses of 0.5−1.2 × 10¹¹ M⊙ for typical velocities v/ sin i = 150−225 km s-1, radii R = 5 kpc (corresponding to a typical observed disk radius of 0.6′′), and an average inclination of 45° (Drouart et al. 2012). This is similar to the expected mass range of a few 1011 M⊙ of our targets that we derived previously (Sect. 7), and within the stellar mass range of powerful HzRGs of a few 1011 M⊙ (Seymour et al. 2007; De Breuck et al. 2010). Moreover, the existence of kpc-scale rotating disks in a few low-redshift radio galaxies (e.g., Emonts et al. 2005; Nesvadba et al. 2011a) suggests that disk rotation is very possible in galaxies with radio sources not much weaker than we find here.
It is interesting, however, that our sources have at the same time smaller velocity gradients and larger nebulosities than in the mass-selected sample of Buitrago et al. (2014). If the velocity gradients we observe are indeed due to rotation, then this would imply that our radio galaxies have shallower mass profiles, which might point toward a different mass assembly history in the two populations. A similar situation is found, however, in the radio-loud, intermediate-redshift quasars of Fu & Stockton (2009), which also have gas that is relatively extended compared to the size of the stellar component of their galaxies, and probes velocity ranges that are smaller than those expected from stellar velocity dispersions. They conclude that the gas kinematics are unlikely to be directly related to rotational motion. At high redshift we cannot probe a similarly clear tracer of galaxy kinematics such as stellar absorption line widths, and therefore cannot address this question directly.
Additional arguments point toward the outflow hypothesis. The extended emission-line regions in all but one source (discussed further in Collet et al. 2015) are aligned with the radio jet axis within 20°−30° as would be expected if the jet were inflating an overpressurized bubble of hot gas. Moreover, hydrodynamic models of jet-driven winds do predict that jets with kinetic power of 1046−47 erg s-1 should accelerate gas to about 500 km s-1, which is consistent with our findings, in particular if we take seeing (Sect. 5.4) and projection effects into account (see also Sect. 8.4).
Most galaxies have velocity maps with significant irregularities even at our relatively low spatial resolution of several kpc. Inspection of Figs. 3 to 4 shows that all but perhaps three sources, NVSS J012932−385433, NVSS J204601−335656, and CEN 072, have significant residuals from simple, smooth, monotonic velocity gradients. This implies significant non-circular motion with sudden velocity jumps of up to several 100 km s-1, over scales of a few kpc. A good example is NVSS J002431−303330, where we see two areas that are redshifted relative to the surrounding gas by about 200 km s-1, or CEN 134, which shows two large regions toward the northwest and southeast, which are blueshifted by up to about 150−200 km s-1 relative to a central ridge of more redshifted gas. It is clear that such kinematics cannot arise from simple disk rotation.
We also find very extended gas in some cases, in particular in NVSS J144932−385657, where the line emission extends over 30 kpc, clearly larger than an individual galaxy. The velocity offset between the two bubbles is 800 km s-1, and the gas has FWHM line widths of up to about 800 km s-1. The K-band image of Bryant et al. (2009a) shows fuzzy, clumpy structures at the sensitivity limit of the data near the eastern emission-line region, but no single, clearly detected continuum source consistent with a galaxy. At the depth of the image, we would have likely missed galaxies with masses significantly lower than that of the radio galaxy; however, it is not clear in this case how the lopsided morphology of the southern bubble relative to the continuum of the radio galaxy, nor the fairly high gas surface brightness in this putative small galaxy could be explained. We therefore consider this source as an example of an AGN-driven wind, similar to other HzRGs. The eastern bubble is much smaller than the western bubble; however, similar asymmetries are found in more powerful radio galaxies at the same redshift (Nesvadba et al., in prep.). Moreover, the eastern blueshifted bubble is near the edge of our data cube and may extend farther outside the field of view.
In CEN 134, NVSS 234235−384526, NVSS J144932–385657, and NVSS J004000–303333, the gas is elongated along the radio jet axis, and in NVSS J002431–303330, NVSS J004000–303333, NVSS J030431–315308, NVSS J144932–385657, NVSS J234235–384526, and CEN 134 the largest velocity offsets are also found near that direction (Figs. 3 to 4). This is reminiscent of the “jet-cloud interactions” found in radio galaxies near and far (e.g., Tadhunter 1991) and even in AGNs with low radio power (Fu & Stockton 2009; Müller-Sánchez et al. 2011; Husemann et al. 2013) in the nearby Universe.
Given the small velocity gradients and relatively small gas masses, only a very small fraction of the kinetic jet power would be needed to accelerate the gas to the observed velocities, even if all of the gas were participating in outflows. We approximate the total observed bulk kinetic energy of the gas simply by summing over the bulk kinetic energy in each spatial pixel 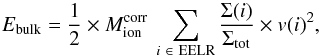 (2)where Mion is the mass of warm ionized gas estimated in Sect. 5.7 corrected for extinction, and v the velocity offset in each pixel from the central velocity, which we consider an acceptable approximation of the systemic velocity of the galaxy. The parameters Σ(i) and Σ(tot) are the gas surface brightness in each spatial pixel and the total line surface brightness, respectively. Measuring the energy in each spatial pixel allows us to take the irregular gas kinematics into account. To probe the disk kinematics out to faint surface brightness, we use the gas kinematics as measured from [OIII], and scale by the Hα/[OIII] ratio in the integrated spectrum. In galaxies where both lines are bright enough to be probed individually, their surface brightness and kinematics are sufficiently similar to justify this approach (see also Nesvadba et al. 2008b).
With the velocities and warm ionized gas masses in Table 6, we find values between Ebulk,min = 0.2 × 1056 erg and Ebulk,max = 1 × 1057 erg in bulk kinetic energy in these galaxies. This corresponds to a small fraction of the mechanical energy carried by the radio jet, a few percentage points or less (Table 6), if we assume typical jet lifetimes on the order of 106−7 yrs. This age range is expected from the dynamical time of our radio jets, assuming a jet advance speed of 0.1 c (Wagner et al. 2012). It is consistent with the general range of a few 106 yrs found by Blundell & Rawlings (1999) from spectral aging considerations of powerful HzRGs (see also Kaiser & Alexander 1997).
Thus, energetically, it would be possible for jets with the observed kinetic power to accelerate the gas to the observed velocities. In particular, this is the case for J144932−385657, where the bulk kinetic energy amounts to 4% of the kinetic energy carried by the radio jet.
8.3. Random motion and kinetic energy
The large line widths are perhaps the most outstanding kinematic property of the gas in our galaxies. They are similar to those found in the most powerful radio galaxies at z ~ 2 (Nesvadba et al. 2008b), and greater by factors of 2−3 than in other types of massive high-z galaxies. Each source shows a range of line widths, and we deliberately compare them with the broadest widths near the nucleus because we want to quantify the impact of the AGN on the surrounding gas, and this is the gas that we expect to be most affected by the radio jet. Comparing the amplitudes of the velocity gradients, Δv/ 2, with Gaussian line widths σ = FWHM/ 2.355, we generally find ratios of v/σ = 0.3−0.8 (NVSS J144932−385657 has a value of 2.3), compared to v/σ = 1−3.5 in the sample of Buitrago et al. (2014). Rotationally supported disk galaxies in the nearby universe typically have v/σ ~ 10. Individual values of our sources are listed in Table 5.
At z ~ 2 we cannot infer directly whether these line widths reflect spatially unresolved velocity offsets on smaller scales, strong turbulent motion, or a combination of both. In all cases, this suggests the presence of an additional source of kinetic energy in our galaxies that is stirring the gas up, and which is absent in the general population of very massive high-z galaxies.
Finding v/σ ≲ 1 also implies that the gas, even if it is in a rotating disk, cannot be in a stable configuration. Except for implausibly high inclination angles, gas in the line wings is at velocities above the local escape velocity from the disk, and is therefore not gravitationally bound. Nevertheless, most of the gas may be bound to the galaxy itself, since the escape velocity of galaxies of a few 1011 M⊙ is about 700 km s-1 (Nesvadba et al. 2006). This would imply that most of the gas that is being lifted off the disk will slow down as it rises to larger galactic radii, and ultimately rain back toward the center of the radio galaxy (e.g., Alatalo et al. 2011). This is particularly the case if turbulence is indeed the cause of the line broadening, since turbulent dissipation times are very short (Mac Low 1999).
Disks with low v/σ values that are highly turbulent and not gravitationally bound have been studied in a few individual cases at low redshift (Alatalo et al. 2011; Nesvadba et al. 2011a), and are characterized by large line widths and complex line profiles as we find here. These disks are very different from classical thin disks, for example, in spiral galaxies. The complex line profiles and low volume filling factors suggest the gas is generally filamentary and diffuse, and cannot form gravitationally bound clouds and stars. Densities even in the molecular gas traced by CO millimeter line emission are only on the order of a few 1000 cm-3 (Nesvadba et al. 2010), not very different from those we find in the ionized gas of HzRGs (Collet et al. 2015; Nesvadba et al. 2008b). To understand the peculiar properties of these disks, in particular the absence of clear signatures of ongoing and past star formation, Nesvadba et al. (2011a) proposed that the dense gas in these disks may have formed from the diffuse ISM through the pressure enhancement in the cocoon inflated by the radio jet. Although this scenario requires more observations at low redshift to be confirmed, the broad properties of our targets may suggest that they may be fundamentally similar to these gas-rich radio galaxies in the nearby Universe.
It is interesting to compare the kinetic energy in random motion with that in bulk motion. To constrain the energy of random motion (which we loosely refer to as turbulent energy) we set 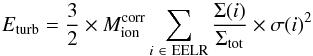 (3)with velocity dispersion σ, i.e., FWHM/2.355. With the line widths measured previously, we find values in the range Eturb,min = 2.6 × 1057 erg and Eturb,max = 31 × 1057 erg in turbulent kinetic energy. For typical jet ages of a few 106−7 yrs, this corresponds to energy injection rates of a few 1042 to 1044 erg s-1 (our precise numbers are for a fiducial 107 yrs). The turbulent energy corresponds to a few tenths of a percent to a small percentage of the mechanical energy carried by the radio jet.
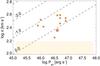 |
Fig. 12 Gas velocity as a function of kinetic jet power, Pjet, for our galaxies (red dots) and in the model of Wagner et al. (2012) for different Eddington ratios (dashed lines). The black star marks NVSS J201943−364542, where we have a direct estimate of the Eddington ratio. The light orange hatched area marks the velocity range in the sample of Buitrago et al. (2014), which has no signatures of powerful AGNs. This suggests that for jets less powerful than ours, kinematic signatures will be very difficult to disentangle from other kinematic processes at high redshift. |
Under the assumption that bulk velocities are solely from radial motion, ratios between bulk and turbulent kinetic energy are typically between 0.2 and <10%, only NVSS J144932−385657 with very extended gas has a ratio of 30%. The small contribution of the bulk kinetic energy to the total kinetic energy budget of the gas implies that the uncertainties owing to the unknown split between rotational and outflow motion do not have a large impact on the total kinetic energy budget of the ionized gas. Finding that the largest ratio of bulk to turbulent motion is in the galaxy with the most extended emission-line regions, NVSS J144932−385657 is interesting. More extended emission-line regions would be consistent with an outflow where dissipational losses through turbulence or random motion are less important.
Summing the bulk and turbulent kinetic energy, we find that the AGN deposits 3−10% of the jet kinetic energy in the gas. This is similar to the range found in very powerful HzRGs (Nesvadba et al. 2008b), but a significant difference is that the energy in random motion appears to be an order of magnitude greater than that in ordered motion (on kpc scales), whereas both are roughly equal in very powerful sources.
Depending on the nature of the “turbulent” motion, this can have one of two consequences. Either the line broadening is caused by strong velocity changes over very small scales, in which case we may underestimate the intrinsic velocity of the gas because of beam smearing effects, and perhaps blending of high-velocity gas components with more quiescent gas in an underlying disk. Low-redshift equivalents include the compact radio galaxies of Holt et al. (2008), for example, or the broadening is indeed from turbulent motion, in which case even fairly high-velocity gas may decelerate rapidly (because turbulent dissipation times are likely short Mac Low 1999) and rain back onto the disk.
It appears uncertain in either case whether significant parts of the observed gas will escape from these galaxies in the current radio activity cycle, unless our radio sources undergo phases of significantly higher power during the current activity cycle, and we have merely observed them in an atypically low-power phase.
In either case, our findings are at odds with the simple scenario whereby AGN feedback acts mainly by removing the gas (e.g., Di Matteo et al. 2005). A cyclical model whereby gas cools down and accumulates at small radii near the supermassive black hole before igniting another feedback episode, as has previously been suggested for the central galaxies of massive galaxy clusters (Pizzolato & Soker 2005), may therefore be more appropriate here. Statistical evidence for recurrent AGN activity has recently also been discussed by Hickox et al. (2014).
8.4. Comparison with hydrodynamic jet models
We will now compare our model with the hydrodynamic models of Wagner et al. (2012) who quantify the energy transfer from jets into the ambient gas in radio jet cocoons. They assume a clumpy, fractal two-phase medium with a density distribution set by interstellar turbulence like that found by Padoan & Nordlund (2011). The range in jet power they cover with their 29 models is 1043−46 erg s-1, well matched to our sources, and Eddington ratios η = 10-4 to 1.
They find that 30% of the jet energy is transferred into the gas, mainly through ram pressure transfer of partially thermalized gas streams occurring in low-density channels between denser clouds. This energy transfer corresponds approximately to the ratio of gas kinetic to jet mechanical energy that we measure in our data. The values found in the simulations are somewhat higher than the values we find; however, our data can only be a lower limit to the actual energy transfer since we do not observe all gas phases. In particular the hot, X-ray emitting gas and the molecular gas are missing. Likewise, uncertainties may arise from the details of the density distribution of the gas, filling factors, etc., since the ISM properties of high-redshift galaxies are not very well constrained yet. In particular, cloud sizes – a parameter that is not observationally constrained at z ~ 2 – appears to play a major role (Wagner et al. 2012). Overall, given these uncertainties, we consider the correspondence between the model and data of an energy transfer in the range of a few percentage points very encouraging.
This correspondence is also illustrated in Fig. 12, which was inspired by Fig. 11 in Wagner et al. (2012). It shows the expected gas velocities as a function of radio power for a range of Eddington ratios. Our jets span the range of about 1046−47 erg s-1, which for Eddington ratios of 0.1 to 0.01 correspond to velocities of about 250−500 km s-1. This is somewhat higher than the velocity offsets we observe, which might in part be attributable to orientation effects and beam smearing.
However, what we plot in Fig. 12 are not the velocity offsets, but the Gaussian widths of the integrated spectral lines, i.e., the overall luminosity-weighted range of velocities from random gas motion. This may further underline that a large part of the energy injected by the radio jet in our galaxies does not result in an ordered, large-scale outflow, but is either causing local small-scale bulk motion or is ultimately being transformed into turbulent motion. As Wagner et al. (2012) point out, estimating the long-term behavior of the gas kinematics over kpc scales is not possible with the current set of simulations, which only follow the evolution of the gas in the first 103 kyrs.
The hatched area in Fig. 12 indicates the range of velocity dispersions measured by Buitrago et al. (2014) and illustrates that for jets less powerful that those of our sources, it will be difficult to identify the fingerprints of high-redshift AGNs with observations of the kinematics of warm ionized gas in the presence of other processes.
8.4.1. Radiative quasar feedback?
Another possible feedback mechanism that has recently been widely discussed in the literature is radiative feedback from the bolometric energy output of AGNs. It is attractive to explain the black hole bulge scaling relationships via radiative processes because the accretion rates implied by number counts of optically selected quasars appear to be a good match to the local black hole demographics (e.g., Yu & Tremaine 2002). In spite of recent claims of AGN-driven bubbles and winds in bright, low-redshift quasars (e.g., Liu et al. 2013), statistical evidence is still rather scarce. For example, so far it has not been possible to find deviations in the star formation rates of X-ray selected AGN hosts and galaxies without AGNs (e.g., Mullaney et al. 2012).
Radiation pressure has received particular attention in the recent literature. Each time a photon scatters on a dust (or gas) particle in the ISM it produces a small recoil in the ISM particle, with a net momentum transfer for fluxes that are high enough, in particular when the gas is optically thick, so that many interactions happen per photon. Murray et al. (2005) derived analytic equations to approximate the expected gas velocities as a function of quasar luminosity. Using their Eq. (17), we set 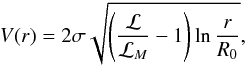 (4)where σ is the stellar velocity dispersion of the host galaxy, which we estimate below; ℒ is the quasar luminosity; R0 is the launch radius of the outflow; and r the radius at which the velocity of the wind is measured;
  is a critical luminosity that depends on the stellar velocity dispersion σ, the speed of light c, gravitational constant G, and the gas fraction fg. For ℒ > ℒM, radiation pressure may launch a wind. These equations are appropriate for the limiting case of an optically thick wind, in which case the interaction is extremely efficient. For these estimates we assume a launch radius of the wind (R0) of a few 100 pc (the sizes of the circumnuclear molecular disks found in low-redshift ULIRGs Downes & Solomon 1998; and the lowest value in the AGN feedback models of Ciotti et al. 2009, 2010), and an outflow radius, r, of 5 kpc, roughly the radius that we spatially resolve.
We have an Lbol estimate for J201943−364542 from Hα, which gives 5 × 1045 erg s-1. For a fiducial mass of 5 × 10¹⁰ M⊙ in a pressure-supported isothermal sphere (approximated by the lowest dynamical mass estimate found in Sect. 7), we find a velocity dispersion of 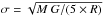 , mass M, gravitational constant G, and radius R. For higher mass estimates, the critical luminosity will also be greater. We assume R = 3 kpc, which gives a velocity dispersion of σ = 210 km s-1. The critical luminosity to launch a wind, ℒM, for this velocity dispersion and a gas fraction of 10% is ℒM = 3.5 × 1046 erg s-1. This suggests that the AGNs in our sources, unless J201943−364542 is atypically weak, do not have sufficiently powerful quasars to launch fast outflows. We should also note that the Murray et al. estimate is, strictly speaking, only valid for buried quasars, whereas the overall low extinction in our sources (Sect. 5.5) suggests that our galaxies are not very dusty. Hence, the actual energy transfer from the AGNs to the gas should be lower than estimated here. For this estimate, we used a very low value for the fiducial mass. Had we used the average mass of the HzRGs from the Herge sample instead (Seymour et al. 2007; De Breuck et al. 2010), 2 × 10¹¹ M⊙, we would have found a circular velocity of 420 km s-1, and a critical luminosity of 5.5 × 1047 erg s-1.
9. A generic phase in the evolution of massive high-redshift galaxies
The radio luminosity functions of Willott et al. (2001) and Gendre et al. (2010) suggest that galaxies with a radio power of 1027−28 W Hz-1 have co-moving number densities of 10− (7−6) Mpc-3 at z ~ 2, whereas the general population of massive high-redshift galaxies have densities of a few 10-5 Mpc-3 (e.g., Mancini et al. 2009, for Mstellar ≥ 1010.5 M⊙). This suggests that phases of radio activity in this power range could be a generic phase in the evolution of massive galaxies at these redshifts, if the activity timescales are short enough, a few 107 yrs. To estimate the duty cycle correction, we assumed a typical formation epoch of z ~ 10 for massive high-z galaxies (e.g., Rocca-Volmerange et al. 2013), which implies an age of about 2 Gyr for massive galaxies at z ~ 2. The ratio of co-moving number densities of radio galaxies and massive galaxies overall would then imply a duty cycle of about 100, i.e., an activity timescale of a few 107 yrs, which is consistent with the young ages of high-redshift radio sources estimated from adiabatic jet expansion models (Blundell & Rawlings 1999; see also Kaiser & Alexander 1997), and the empirical finding of Sajina et al. (2007) that one-third of the infrared selected starburst galaxies at z ~ 2 have extended radio jets with powers of a few 1025 W Hz-1.
It thus appears possible that the majority of massive galaxies experienced such a phase of moderate radio activity if these phases were sufficiently short (a few 107 yrs, see also Venemans et al. 2007; Nesvadba et al. 2008b). By studying a sample of radio-selected galaxies, we might expect to predominantly probe galaxies in dense environments (Best 2000; Hatch et al. 2014). Eight of our sources are part of the CARLA survey (Wylezalek et al. 2013) with Spitzer, which measures the density of galaxies with mid-infrared colors consistent with being at redshifts z ≥ 1.3 around HzRGs. Only one source, NVSS J204601−335656, has an environment that exceeds the density of galaxies in the field by more than 3σ. This suggests that environment does not likely play a dominant role, particularly as massive galaxies generally prefer dense environments (e.g., Baldry et al. 2006).
10. Summary
We presented a combined SINFONI and ATCA study of 18 high-redshift radio galaxies at z ~ 2−3.5 taken from the MRCR-SUMSS and CENSORS surveys. Their radio power is in the range of a few 1026−27 W Hz-1 at 1.4 GHZ, 1−2 orders of magnitude lower than in the most powerful high-redshift radio galaxies known, but higher than that produced by the most intense high-z starbursts alone. Our goal is to investigate the ability of moderately powerful radio jets to accelerate and heat the gas of their host galaxies in order to regulate the star formation, and the significance of this process in such a case.
In the NIR imaging spectroscopy observations of our sample, we typically detect faint, unresolved continuum emission around which we find extended emission-line regions (clearly seen in [OIII] and Hα). The kinematic properties of this ionized gas are diverse among our sample: some sources (e.g., NVSS J012932−385433, CEN 072) show large-scale and smooth velocity gradients, but of small amplitude (typically ≲400 km s-1), while other sources have very irregular velocity fields (e.g., NVSS J002431−303330). A common feature of all sources in our sample are their large velocity dispersions, FWHM = 400−1000 km s-1. The small ratios of bulk velocities to velocity dispersions indicate that the observed ionized gas cannot be in a stable rotating disk, even in cases where smooth velocity gradients are detected.
Our estimates of ionized gas masses are in the range of a few 108 M⊙, which is at least one order of magnitude less than was previously found in the most powerful radio galaxies. For two sources, we found distinct emission-line regions in the vicinity of the radio galaxy. Assuming they are associated with satellite galaxies, we used them to estimate the dynamical mass of the radio galaxy, and we found a few 1011 M⊙, which is comparable to the typical mass of HzRGs (e.g., Seymour et al. 2007; De Breuck et al. 2010). In one source (NVSS J201943−364542), we find a broad component of Hα with FWHM ~ 8250 km s-1. We interpret this as the signature of the nuclear broad-line region and derive the mass (MBH ~ 2.1 M⊙) and bolometric luminosity (5.3 × 1045 erg s-1) of the supermassive black hole. This suggests an Eddington ratio of ~2%.
We explore different possible sources of energy that can explain the large observed kinetic energy in the ionized gas: transfer from the radio jet or radiation pressure from the large bolometric luminosity of the AGNs. We show that an energy transfer from the radio jet to the ionized gas is a plausible scenario. Our estimates demonstrate that a fraction of the radio jet power is sufficient to power the kinematics of the ionized gas. Our observations are in agreement with the predictions of hydrodynamical models (see, e.g., Wagner et al. 2012).
Acknowledgments
We are very grateful to the staff at Paranal for having carried out the observations on which our analysis is based and to the staff at the ATCA for their hospitality during our visitor-mode observations. We thank the anonymous referee for inspiring comments which helped improve the paper. NPHN wishes to thank G. Bicknell, C. Tadhunter, and J. Silk for interesting discussions. She also wishes to thank C. Harrison for interesting discussions and for pointing out a missing factor of 1/3 in her previous estimates of warm ionized gas masses. C.C. acknowledges support from the École Doctorale Astronomie & Astrophysique de l’Ile de France. Parts of this research were conducted by the Australian Research Council Centre of Excellence for All-sky Astrophysics (CAASTRO), through project number CE110001020.
References
- Alaghband-Zadeh, S., Chapman, S. C., Swinbank, A. M., et al. 2012, MNRAS, 424, 2232 [NASA ADS] [CrossRef] [Google Scholar]
- Alatalo, K., Blitz, L., Young, L. M., et al. 2011, ApJ, 735, 88 [NASA ADS] [CrossRef] [Google Scholar]
- Alexander, D., Brandt, W., Smail, I., et al. 2008, ApJ, 135, 1968 [Google Scholar]
- Alexander, D. M., Swinbank, A. M., Smail, I., McDermid, R., & Nesvadba, N. P. H. 2010, MNRAS, 402, 2211 [NASA ADS] [CrossRef] [Google Scholar]
- Antonucci, R. 1993, ARA&A, 31, 473 [Google Scholar]
- Baldry, I. K., Balogh, M. L., Bower, R. G., et al. 2006, MNRAS, 373, 469 [NASA ADS] [CrossRef] [Google Scholar]
- Benson, A., Bower, R., Frenk, C., et al. 2003, ApJ, 599, 38 [NASA ADS] [CrossRef] [Google Scholar]
- Best, P. N. 2000, MNRAS, 317, 720 [NASA ADS] [CrossRef] [Google Scholar]
- Best, P. N., Arts, J. N., Röttgering, H. J. A., et al. 2003, MNRAS, 346, 627 [NASA ADS] [CrossRef] [Google Scholar]
- Blundell, K. M., & Rawlings, S. 1999, Nature, 399, 330 [NASA ADS] [CrossRef] [Google Scholar]
- Broderick, J., Bryant, J., Hunstead, R., Sadler, E., & Murphy, T. 2007, MNRAS, 381, 341 [NASA ADS] [CrossRef] [Google Scholar]
- Brookes, M., Best, P., Rengelink, R., & Röttgering, H. 2006, MNRAS, 366, 1265 [NASA ADS] [CrossRef] [Google Scholar]
- Brookes, M., Best, P., Peacock, J., Röttgering, H., & Dunlop, J. 2008, MNRAS, 385, 1297 [NASA ADS] [CrossRef] [Google Scholar]
- Bryant, J., Broderick, J., Johnston, H., et al. 2009a, MNRAS, 394, 2197 [NASA ADS] [CrossRef] [Google Scholar]
- Bryant, J., Johnston, H., Broderick, J., et al. 2009b, MNRAS, 395, 1099 [NASA ADS] [CrossRef] [Google Scholar]
- Buitrago, F., Conselice, C. J., Epinat, B., et al. 2014, MNRAS, 439, 1494 [NASA ADS] [CrossRef] [Google Scholar]
- Cano-Díaz, M., Maiolino, R., Marconi, A., et al. 2012, A&A, 537, L8 [NASA ADS] [CrossRef] [EDP Sciences] [Google Scholar]
- Cardelli, J., Clayton, G., & Mathis, J. 1989, AJ, 345, 245 [Google Scholar]
- Cattaneo, A., Faber, S. M., Binney, J., et al. 2009, Nature, 460, 213 [NASA ADS] [CrossRef] [PubMed] [Google Scholar]
- Cavagnolo, K., McNamara, B., Nulsen, P., et al. 2010, ApJ, 720, 1066 [NASA ADS] [CrossRef] [Google Scholar]
- Ciotti, L., Ostriker, J. P., & Proga, D. 2009, ApJ, 699, 89 [NASA ADS] [CrossRef] [Google Scholar]
- Ciotti, L., Ostriker, J. P., & Proga, D. 2010, ApJ, 717, 708 [NASA ADS] [CrossRef] [Google Scholar]
- Collet, C. 2014, Ph.D. Thesis, Université Paris Sud, France [Google Scholar]
- Collet, C., Nesvadba, N. P. H., De Breuck, C., et al. 2015, A&A, 579, A89 [NASA ADS] [CrossRef] [EDP Sciences] [Google Scholar]
- Coppin, K., Swinbank, A., Neri, R., et al. 2008, MNRAS, 389, 45 [NASA ADS] [CrossRef] [Google Scholar]
- De Breuck, C., Neri, R., & Omont, A. 2003, New Astron. Rev., 47, 285 [NASA ADS] [CrossRef] [Google Scholar]
- De Breuck, C., Seymour, N., Stern, D., et al. 2010, ApJ, 725, 36 [NASA ADS] [CrossRef] [Google Scholar]
- Di Matteo, T., Springel, V., & Hernquist, L. 2005, Nature, 433, 604 [NASA ADS] [CrossRef] [PubMed] [Google Scholar]
- Downes, D., & Solomon, P. M. 1998, ApJ, 507, 615 [NASA ADS] [CrossRef] [Google Scholar]
- Drouart, G., De Breuck, C., Vernet, J., et al. 2012, A&A, 548, A45 [NASA ADS] [CrossRef] [EDP Sciences] [Google Scholar]
- Drouart, G., De Breuck, C., Vernet, J., et al. 2014, A&A, 579, A89 [Google Scholar]
- Eisenhauer, F., Abuter, R., Bickert, K., Biancat-Marchet, F., et al. 2003, SPIE Conf. Ser., 4841, 1548 [Google Scholar]
- Emonts, B. H. C., Morganti, R., Tadhunter, C. N., et al. 2005, MNRAS, 362, 931 [NASA ADS] [CrossRef] [Google Scholar]
- Förster Schreiber, N. M., Genzel, R., Lehnert, M. D., et al. 2006, ApJ, 645, 1062 [NASA ADS] [CrossRef] [Google Scholar]
- Förster Schreiber, N. M., Genzel, R., Bouché, N., et al. 2009, ApJ, 706, 1364 [NASA ADS] [CrossRef] [Google Scholar]
- Fu, H., & Stockton, A. 2009, ApJ, 690, 953 [NASA ADS] [CrossRef] [Google Scholar]
- Galametz, A., Stern, D., De Breuck, C., et al. 2012, ApJ, 749, 169 [NASA ADS] [CrossRef] [Google Scholar]
- Gendre, M., Best, P., & Wall, J. 2010, MNRAS, 404, 1719 [NASA ADS] [Google Scholar]
- Greene, J., & Ho, L. 2005, ApJ, 630, 122 [NASA ADS] [CrossRef] [Google Scholar]
- Greve, T. R., Bertoldi, F., Smail, I., et al. 2005, MNRAS, 359, 1165 [NASA ADS] [CrossRef] [Google Scholar]
- Harrison, C. M., Alexander, D. M., Swinbank, A. M., et al. 2012, MNRAS, 426, 1073 [NASA ADS] [CrossRef] [Google Scholar]
- Hatch, N. A., Overzier, R. A., Kurk, J. D., et al. 2009, MNRAS, 395, 114 [NASA ADS] [CrossRef] [Google Scholar]
- Hatch, N. A., Wylezalek, D., Kurk, J. D., et al. 2014, MNRAS, 445, 280 [NASA ADS] [CrossRef] [Google Scholar]
- Hayashi, M., Kodama, T., Tadaki, K.-I., Koyama, Y., & Tanaka, I. 2012, ApJ, 757, 15 [NASA ADS] [CrossRef] [Google Scholar]
- Heckman, T. M., Kauffmann, G., Brinchmann, J., et al. 2004, ApJ, 613, 109 [NASA ADS] [CrossRef] [Google Scholar]
- Hickox, R. C., Mullaney, J. R., Alexander, D. M., et al. 2014, ApJ, 782, 9 [NASA ADS] [CrossRef] [Google Scholar]
- Holt, J., Tadhunter, C. N., & Morganti, R. 2008, MNRAS, 387, 639 [NASA ADS] [CrossRef] [Google Scholar]
- Humphrey, A., Villar-Martín, M., Vernet, J., et al. 2008, MNRAS, 383, 11 [NASA ADS] [CrossRef] [Google Scholar]
- Husemann, B., Wisotzki, L., Sánchez, S. F., & Jahnke, K. 2013, A&A, 549, A43 [NASA ADS] [CrossRef] [EDP Sciences] [Google Scholar]
- Kaiser, C. R., & Alexander, P. 1997, MNRAS, 286, 215 [NASA ADS] [CrossRef] [Google Scholar]
- Kaspi, S., Smith, P. S., Netzer, H., et al. 2000, ApJ, 533, 631 [NASA ADS] [CrossRef] [Google Scholar]
- Le Fèvre, O., Deltorn, J. M., Crampton, D., & Dickinson, M. 1996, ApJ, 471, L11 [NASA ADS] [CrossRef] [Google Scholar]
- Le Tiran, L., Lehnert, M. D., van Driel, W., Nesvadba, N. P. H., & Di Matteo, P. 2011, A&A, 534, L4 [NASA ADS] [CrossRef] [EDP Sciences] [Google Scholar]
- Liu, G., Zakamska, N. L., Greene, J. E., Nesvadba, N. P. H., & Liu, X. 2013, MNRAS, 436, 2576 [NASA ADS] [CrossRef] [Google Scholar]
- Mac Low, M.-M. 1999, ApJ, 524, 169 [NASA ADS] [CrossRef] [Google Scholar]
- Mancini, C., Matute, I., Cimatti, A., et al. 2009, A&A, 500, 705 [NASA ADS] [CrossRef] [EDP Sciences] [Google Scholar]
- Menéndez-Delmestre, K., Blain, A. W., Swinbank, M., et al. 2013, ApJ, 767, 151 [NASA ADS] [CrossRef] [Google Scholar]
- Miley, G., & De Breuck, C. 2008, A&ARv, 15, 67 [NASA ADS] [CrossRef] [Google Scholar]
- Mullaney, J. R., Daddi, E., Béthermin, M., et al. 2012, ApJ, 753, L30 [NASA ADS] [CrossRef] [Google Scholar]
- Müller-Sánchez, F., Prieto, M. A., Hicks, E. K. S., et al. 2011, ApJ, 739, 69 [NASA ADS] [CrossRef] [Google Scholar]
- Murray, N., Quataert, E., & Thompson, T. A. 2005, ApJ, 618, 569 [NASA ADS] [CrossRef] [Google Scholar]
- Nesvadba, N. P. H., Lehnert, M. D., Eisenhauer, F., et al. 2006, ApJ, 650, 693 [NASA ADS] [CrossRef] [Google Scholar]
- Nesvadba, N. P. H., Lehnert, M. D., De Breuck, C., Gilbert, A., & van Breugel, W. 2007, A&A, 475, 145 [NASA ADS] [CrossRef] [EDP Sciences] [Google Scholar]
- Nesvadba, N., Lehnert, M., De Breuck, C., Gilbert, A., & Van Breugel, W. 2008a, A&A, 491, 407 [NASA ADS] [CrossRef] [EDP Sciences] [Google Scholar]
- Nesvadba, N. P. H., Lehnert, M. D., Davies, R. I., Verma, A., & Eisenhauer, F. 2008b, A&A, 479, 67 [NASA ADS] [CrossRef] [EDP Sciences] [Google Scholar]
- Nesvadba, N., Neri, R., De Breuck, C., et al. 2009, MNRAS, 395, L16 [NASA ADS] [CrossRef] [Google Scholar]
- Nesvadba, N. P. H., Boulanger, F., Salome, P., et al. 2010, A&A, 521, A65 [NASA ADS] [CrossRef] [EDP Sciences] [Google Scholar]
- Nesvadba, N., Boulanger, F., Lehnert, M., Guillard, P., & Salomé, P. 2011a, A&A, 536, L5 [NASA ADS] [CrossRef] [EDP Sciences] [Google Scholar]
- Nesvadba, N. P. H., De Breuck, C., Lehnert, M., et al. 2011b, A&A, 525, A43 [NASA ADS] [CrossRef] [EDP Sciences] [Google Scholar]
- Nesvadba, N. P. H., Polletta, M., Lehnert, M., et al. 2011c, MNRAS, 415, 2359 [NASA ADS] [CrossRef] [Google Scholar]
- Osterbrock, D. E. 1989, Astrophysics of Gaseous Nebulae and Active Galactic Nuclei (University Science Books) [Google Scholar]
- Padoan, P., & Nordlund, Å. 2011, ApJ, 730, 40 [NASA ADS] [CrossRef] [Google Scholar]
- Peterson, B. M., Ferrarese, L., Gilbert, K. M., et al. 2004, ApJ, 613, 682 [NASA ADS] [CrossRef] [Google Scholar]
- Pettini, M., Shapley, A. E., Steidel, C. C., et al. 2001, ApJ, 554, 981 [NASA ADS] [CrossRef] [Google Scholar]
- Pizzolato, F., & Soker, N. 2005, ApJ, 632, 821 [NASA ADS] [CrossRef] [Google Scholar]
- Rocca-Volmerange, B., Drouart, G., De Breuck, C., et al. 2013, MNRAS, 429, 2780 [NASA ADS] [CrossRef] [Google Scholar]
- Sajina, A., Yan, L., Lacy, M., & Huynh, M. 2007, ApJ, 667, L17 [NASA ADS] [CrossRef] [Google Scholar]
- Sault, R., Teuben, P., & Wright, M. 1995, in Astronomical Data Analysis Software and Systems IV, ASP Conf. Ser., 77, 433 [NASA ADS] [Google Scholar]
- Seymour, N., Stern, D., De Breuck, C., et al. 2007, ApJS, 171, 353 [NASA ADS] [CrossRef] [Google Scholar]
- Seymour, N., Huynh, M., Dwelly, T., et al. 2009, MNRAS, 398, 1573 [Google Scholar]
- Shapiro, K. L., Genzel, R., Quataert, E., et al. 2009, ApJ, 701, 955 [NASA ADS] [CrossRef] [Google Scholar]
- Silk, J., & Rees, M. J. 1998, A&A, 331, L1 [NASA ADS] [Google Scholar]
- Stockton, A. 1976, ApJ, 205, L113 [NASA ADS] [CrossRef] [Google Scholar]
- Sulentic, J., Marziani, P., & Dultzin-Hacyan, D. 2000, ARA&A, 38, 521 [NASA ADS] [CrossRef] [Google Scholar]
- Tacconi, L. J., Genzel, R., Smail, I., et al. 2008, ApJ, 680, 246 [NASA ADS] [CrossRef] [PubMed] [Google Scholar]
- Tadhunter, C. N. 1991, MNRAS, 251, 46 [Google Scholar]
- Tadhunter, C. N., Morganti, R., di Serego-Alighieri, S., Fosbury, R. A. E., & Danziger, I. J. 1993, MNRAS, 263, 999 [NASA ADS] [CrossRef] [Google Scholar]
- Tadhunter, C. N., Morganti, R., Robinson, A., et al. 1998, MNRAS, 298, 1035 [NASA ADS] [CrossRef] [Google Scholar]
- Thomson, A. P., Ivison, R. J., Simpson, J. M., et al. 2014, MNRAS, 442, 577 [NASA ADS] [CrossRef] [Google Scholar]
- Tody, D. 1993, in Astronomical Data Analysis Software and Systems II, eds. R. J. Hanisch, R. J. V. Brissenden, & J. Barnes, ASP Conf. Ser., 52, 173 [Google Scholar]
- Tremaine, S., Gebhardt, K., Bender, R., et al. 2002, ApJ, 574, 740 [NASA ADS] [CrossRef] [Google Scholar]
- van Breugel, W., Miley, G., Heckman, T., Butcher, H., & Bridle, A. 1985, ApJ, 290, 496 [NASA ADS] [CrossRef] [Google Scholar]
- van Ojik, R., Röttgering, H., Miley, G., & Hunstead, R. 1997, A&A, 317, 358 [NASA ADS] [Google Scholar]
- Venemans, B. P., Röttgering, H. J. A., Miley, G. K., et al. 2007, A&A, 461, 823 [NASA ADS] [CrossRef] [EDP Sciences] [Google Scholar]
- Vernet, J., Fosbury, R. A. E., Villar-Martín, M., et al. 2001, A&A, 366, 7 [NASA ADS] [CrossRef] [EDP Sciences] [Google Scholar]
- Villar-Martín, M., Vernet, J., di Serego Alighieri, S., et al. 2003, MNRAS, 346, 273 [NASA ADS] [CrossRef] [Google Scholar]
- Vlahakis, C., Eales, S., & Dunne, L. 2007, MNRAS, 379, 1042 [NASA ADS] [CrossRef] [Google Scholar]
- Wagner, A. Y., Bicknell, G. V., & Umemura, M. 2012, ApJ, 757, 136 [NASA ADS] [CrossRef] [Google Scholar]
- Willott, C., Rawlings, S., Blundell, K., & Lacy, M. 1999, MNRAS, 309, 1017 [NASA ADS] [CrossRef] [Google Scholar]
- Willott, C., Rawlings, S., Blundell, K., Lacy, M., & Eales, S. 2001, MNRAS, 322, 536 [NASA ADS] [CrossRef] [Google Scholar]
- Wylezalek, D., Galametz, A., Stern, D., et al. 2013, ApJ, 769, 79 [NASA ADS] [CrossRef] [Google Scholar]
- Yu, Q., & Tremaine, S. 2002, MNRAS, 335, 965 [NASA ADS] [CrossRef] [Google Scholar]
Appendix A: Additional figures
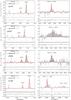 |
Fig. A.1 Integrated spectra of our sources. Gaussian fits to detected lines are plotted as solid red lines. Below each spectrum we show a typical night-sky spectrum to illustrate the position of bright night-sky lines (dashed lines). This spectrum is not to scale; the night-sky lines shown are typically at least factors of a few brighter than the emission lines from our targets. The bottom panel shows the fit residuals. |
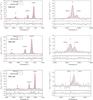 |
Fig. A.2 Spectra of the CENSORS sample, integrated over pixels where the [OIII] emission line is detected at SNR> 5. The left column shows spectra centered on the Hβ and [OIII] doublet emission lines and the right column is centered on the Hα + [NII] complex. All lines are well fitted by single Gaussians with the parameters listed in Table 2. Below each spectrum we show a typical night-sky spectrum to illustrate the position of bright night-sky lines (dashed lines). This spectrum is not to scale; the night-sky lines shown are typically at least factors of a few brighter than the emission lines from our targets. The bottom panel shows the fit residuals. |
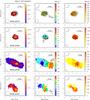 |
Fig. A.3 Maps of [OIII] surface brightness (left), velocity (center), and FWHM line widths (right). All maps are 4′′×4′′ wide, except for NVSS J144932−385657 and NVSS J210626−314003, where they are 5′′×5′′ wide. The circle in the bottom left represents the FWHM size of the seeing disk. Contours mark the continuum where detected. Continuum levels begin at 3σ and then increase in steps of 1σ. The solid black line in the velocity maps indicates the axis of the radio emission from our ATCA data, or from Broderick et al. (2007) if the source is compact. Numbers give the largest angular size in arcsec. |
Appendix B: Additional tables
Rest-frame UV/optical source properties and observational parameters.
ATCA observing log for the MRCR−SUMSS sample.
All Tables
All Figures
|
Fig. 1 Radio morphologies at 5.5 GHz of the MRCR-SUMSS sample. The size and orientation of the restored beam is given in the bottom left of each panel. The red box indicates the size and location of the SINFONI maps presented in Fig. 2. For NVSS J144932−385657, given the short observation time of this source and hence the deformed beam, we also present its 4.8 GHz observations from Bryant et al. (2009a), who observed a part of their sample at 4.8 GHz and 8.64 GHz. |
| In the text | |
|
Fig. 2 Integrated spectra of our sources. Gaussian fits to detected lines are plotted as solid red lines. Below each spectrum we show a typical night-sky spectrum to illustrate the position of bright night-sky lines (dashed lines). This spectrum is not to scale; the night-sky lines shown are brighter than the emission lines from our targets. The bottom panel shows the fit residuals. |
| In the text | |
|
Fig. 3 Maps of [OIII] surface brightness (left), velocity (center), and FWHM line width (right) of our nine sources (from top to bottom). All maps are 4′′×4′′wide, except for NVSS J144932−385657 and NVSS J210626−314003, where they are 5′′×5′′wide. The circle in the bottom left represents the FWHM size of the seeing disk. Contours mark the continuum where detected. Continuum levels begin at 3σ and then increase in steps of 1σ. The solid black line in the velocity maps indicates the axis of the radio emission from our ATCA data, or from Broderick et al. (2007) if the source is compact. Numbers give half the largest angular size in arcsec. |
| In the text | |
|
Fig. 4 Maps of [OIII] surface brightness (left), velocity (middle), and FWHM line width (right) of the three sources from the CENSORS sample. All maps are 4′′×4′′ on each side. The ellipse in the bottom corner shows the FWHM size of the seeing disk. Contours mark the stellar continuum emission, detected in the same datacube, beginning at the 3σ level and increasing by steps of 3σ. |
| In the text | |
|
Fig. 5 Spectra extracted from the subregions of NVSS J002431−303330 shown in Fig. 2. a) Spectrum from the continuum region, with broad [OIII] lines (FWHM ~ 1150 km s-1). b) Spectrum of the quiescent gas, with much more narrow lines (FWHM ~ 450 km s-1). |
| In the text | |
|
Fig. 6 Maps of NVSS J004000−303333 at SNR ≥ 3.0. A second emission-line region clearly appears ~2′′ to the south of NVSS J004000−303333, blueshifted by 350 ± 90 km s-1 relative to NVSS J004000−303333. |
| In the text | |
|
Fig. 7 Surface brightness maps of NVSS J144932−385657 at SNR ≥ 3.0 for the [OIII]λ5007, Hα, and [NII]λ6583 emission lines. The contours in the left panel show the continuum and in the other panels the [OIII] emission-line morphology. |
| In the text | |
|
Fig. 8 Left to right: surface brightness maps of NVSS J210626−314003 of the [OIII], Hα, and [NII]. Lines with SNR ≥ 3.0 are shown. Contours in the central and right panel show the [OIII] morphology to facilitate orientation. |
| In the text | |
|
Fig. 9 Left: integrated spectrum of the southern part of the emission-line region of NVSS J004000−303333 that appears for SNR ≥ 3 and that is blueshifted at |
| In the text | |
|
Fig. 10 Results of our toy models to estimate the impact of an unresolved, putative narrow-line region on our estimates of the extended gas kinematics. See Sect. 5.3 for details. Left: surface brightness map. Center: FWHMs of the cube with extended and narrow-line component. Right: relative increase in line widths between the cube with and without a narrow-line region. The red circles show radii corresponding to 1 and 1.5 times the size of the seeing disk. |
| In the text | |
|
Fig. 11 Integrated spectrum of the artificial data cube shown in Fig. 10. The broad- and narrow-line components are clearly distinguishable, and the line profile is more reminiscent of bright quasars than the radio galaxies discussed here (see also Sect. 8.1). |
| In the text | |
|
Fig. 12 Gas velocity as a function of kinetic jet power, Pjet, for our galaxies (red dots) and in the model of Wagner et al. (2012) for different Eddington ratios (dashed lines). The black star marks NVSS J201943−364542, where we have a direct estimate of the Eddington ratio. The light orange hatched area marks the velocity range in the sample of Buitrago et al. (2014), which has no signatures of powerful AGNs. This suggests that for jets less powerful than ours, kinematic signatures will be very difficult to disentangle from other kinematic processes at high redshift. |
| In the text | |
|
Fig. A.1 Integrated spectra of our sources. Gaussian fits to detected lines are plotted as solid red lines. Below each spectrum we show a typical night-sky spectrum to illustrate the position of bright night-sky lines (dashed lines). This spectrum is not to scale; the night-sky lines shown are typically at least factors of a few brighter than the emission lines from our targets. The bottom panel shows the fit residuals. |
| In the text | |
|
Fig. A.2 Spectra of the CENSORS sample, integrated over pixels where the [OIII] emission line is detected at SNR> 5. The left column shows spectra centered on the Hβ and [OIII] doublet emission lines and the right column is centered on the Hα + [NII] complex. All lines are well fitted by single Gaussians with the parameters listed in Table 2. Below each spectrum we show a typical night-sky spectrum to illustrate the position of bright night-sky lines (dashed lines). This spectrum is not to scale; the night-sky lines shown are typically at least factors of a few brighter than the emission lines from our targets. The bottom panel shows the fit residuals. |
| In the text | |
|
Fig. A.3 Maps of [OIII] surface brightness (left), velocity (center), and FWHM line widths (right). All maps are 4′′×4′′ wide, except for NVSS J144932−385657 and NVSS J210626−314003, where they are 5′′×5′′ wide. The circle in the bottom left represents the FWHM size of the seeing disk. Contours mark the continuum where detected. Continuum levels begin at 3σ and then increase in steps of 1σ. The solid black line in the velocity maps indicates the axis of the radio emission from our ATCA data, or from Broderick et al. (2007) if the source is compact. Numbers give the largest angular size in arcsec. |
| In the text | |
Current usage metrics show cumulative count of Article Views (full-text article views including HTML views, PDF and ePub downloads, according to the available data) and Abstracts Views on Vision4Press platform.
Data correspond to usage on the plateform after 2015. The current usage metrics is available 48-96 hours after online publication and is updated daily on week days.
Initial download of the metrics may take a while.