Fig. 9
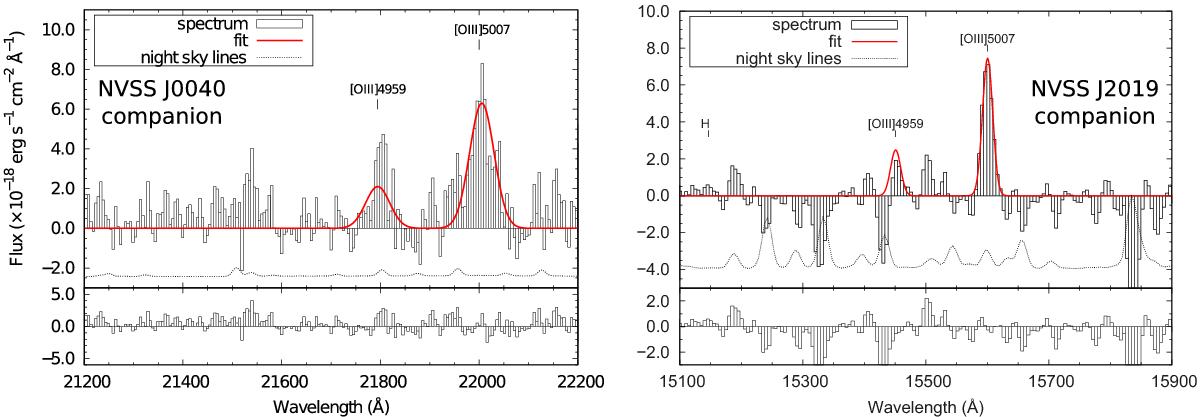
Left: integrated spectrum of the southern part of the emission-line region of NVSS J004000−303333 that appears for SNR ≥ 3 and that is blueshifted at ![]() , as illustrated in Fig. 6. Right: spectrum integrated over a 1.0′′×1.0′′ box situated 3.2′′ to the south-southeast of NVSS J201943−364542. The [OIII] emission is detected at redshift
, as illustrated in Fig. 6. Right: spectrum integrated over a 1.0′′×1.0′′ box situated 3.2′′ to the south-southeast of NVSS J201943−364542. The [OIII] emission is detected at redshift ![]() .
.
Current usage metrics show cumulative count of Article Views (full-text article views including HTML views, PDF and ePub downloads, according to the available data) and Abstracts Views on Vision4Press platform.
Data correspond to usage on the plateform after 2015. The current usage metrics is available 48-96 hours after online publication and is updated daily on week days.
Initial download of the metrics may take a while.