Free Access
Fig. 7
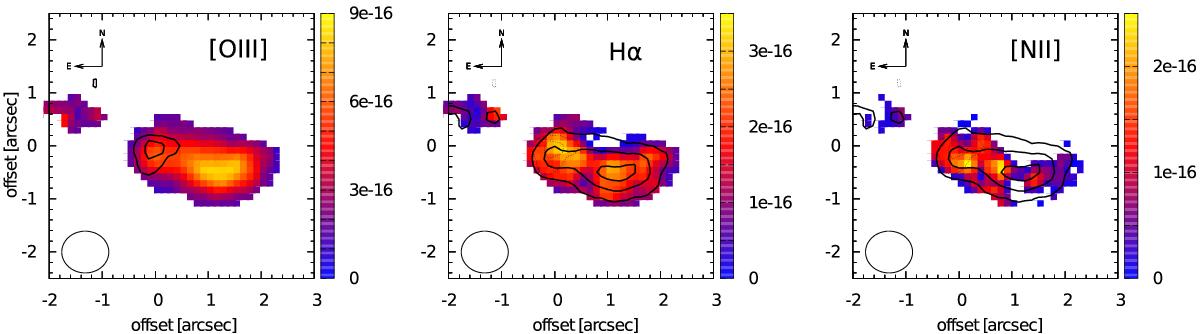
Surface brightness maps of NVSS J144932−385657 at SNR ≥ 3.0 for the [OIII]λ5007, Hα, and [NII]λ6583 emission lines. The contours in the left panel show the continuum and in the other panels the [OIII] emission-line morphology.
Current usage metrics show cumulative count of Article Views (full-text article views including HTML views, PDF and ePub downloads, according to the available data) and Abstracts Views on Vision4Press platform.
Data correspond to usage on the plateform after 2015. The current usage metrics is available 48-96 hours after online publication and is updated daily on week days.
Initial download of the metrics may take a while.