Fig. 4
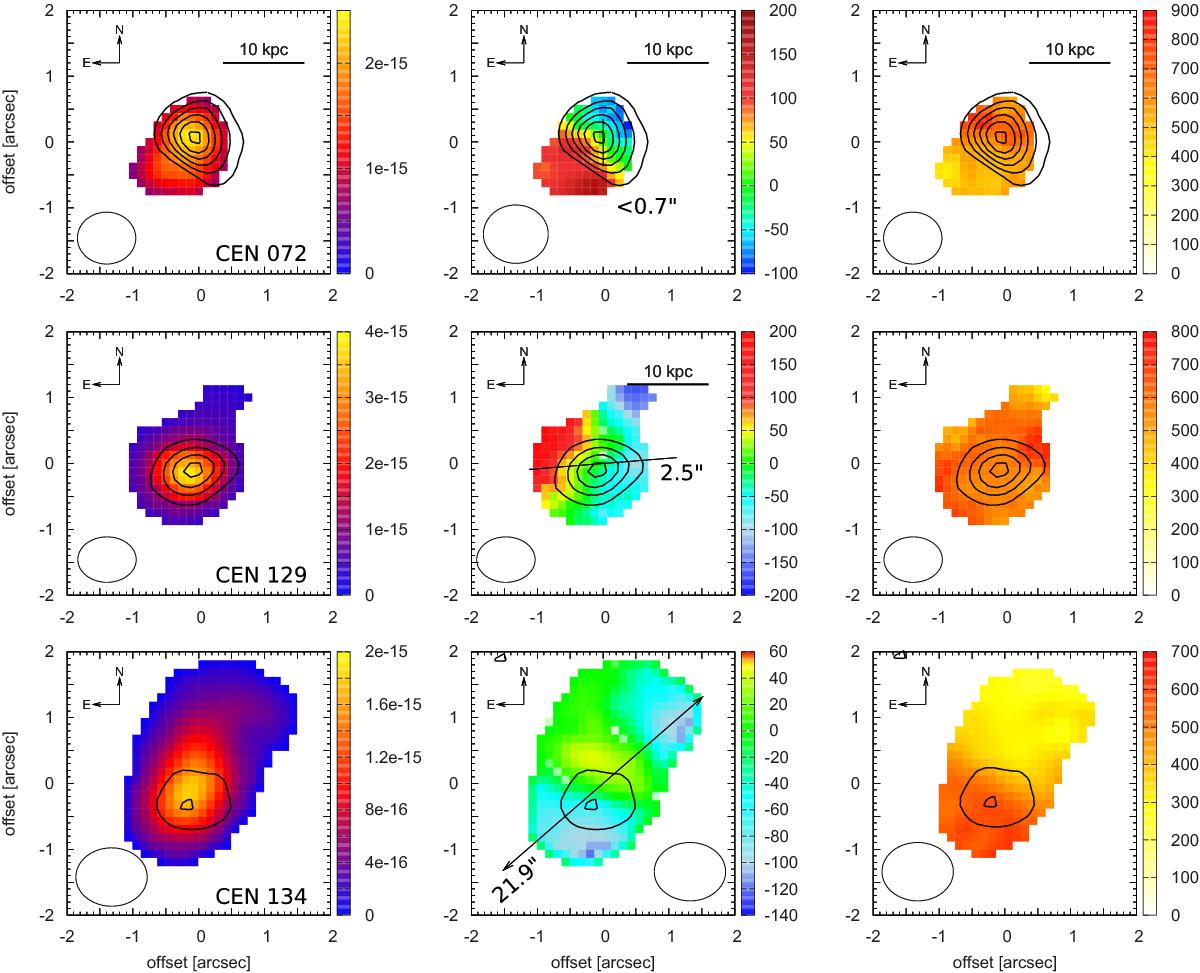
Maps of [OIII] surface brightness (left), velocity (middle), and FWHM line width (right) of the three sources from the CENSORS sample. All maps are 4′′×4′′ on each side. The ellipse in the bottom corner shows the FWHM size of the seeing disk. Contours mark the stellar continuum emission, detected in the same datacube, beginning at the 3σ level and increasing by steps of 3σ.
Current usage metrics show cumulative count of Article Views (full-text article views including HTML views, PDF and ePub downloads, according to the available data) and Abstracts Views on Vision4Press platform.
Data correspond to usage on the plateform after 2015. The current usage metrics is available 48-96 hours after online publication and is updated daily on week days.
Initial download of the metrics may take a while.