Fig. A.2
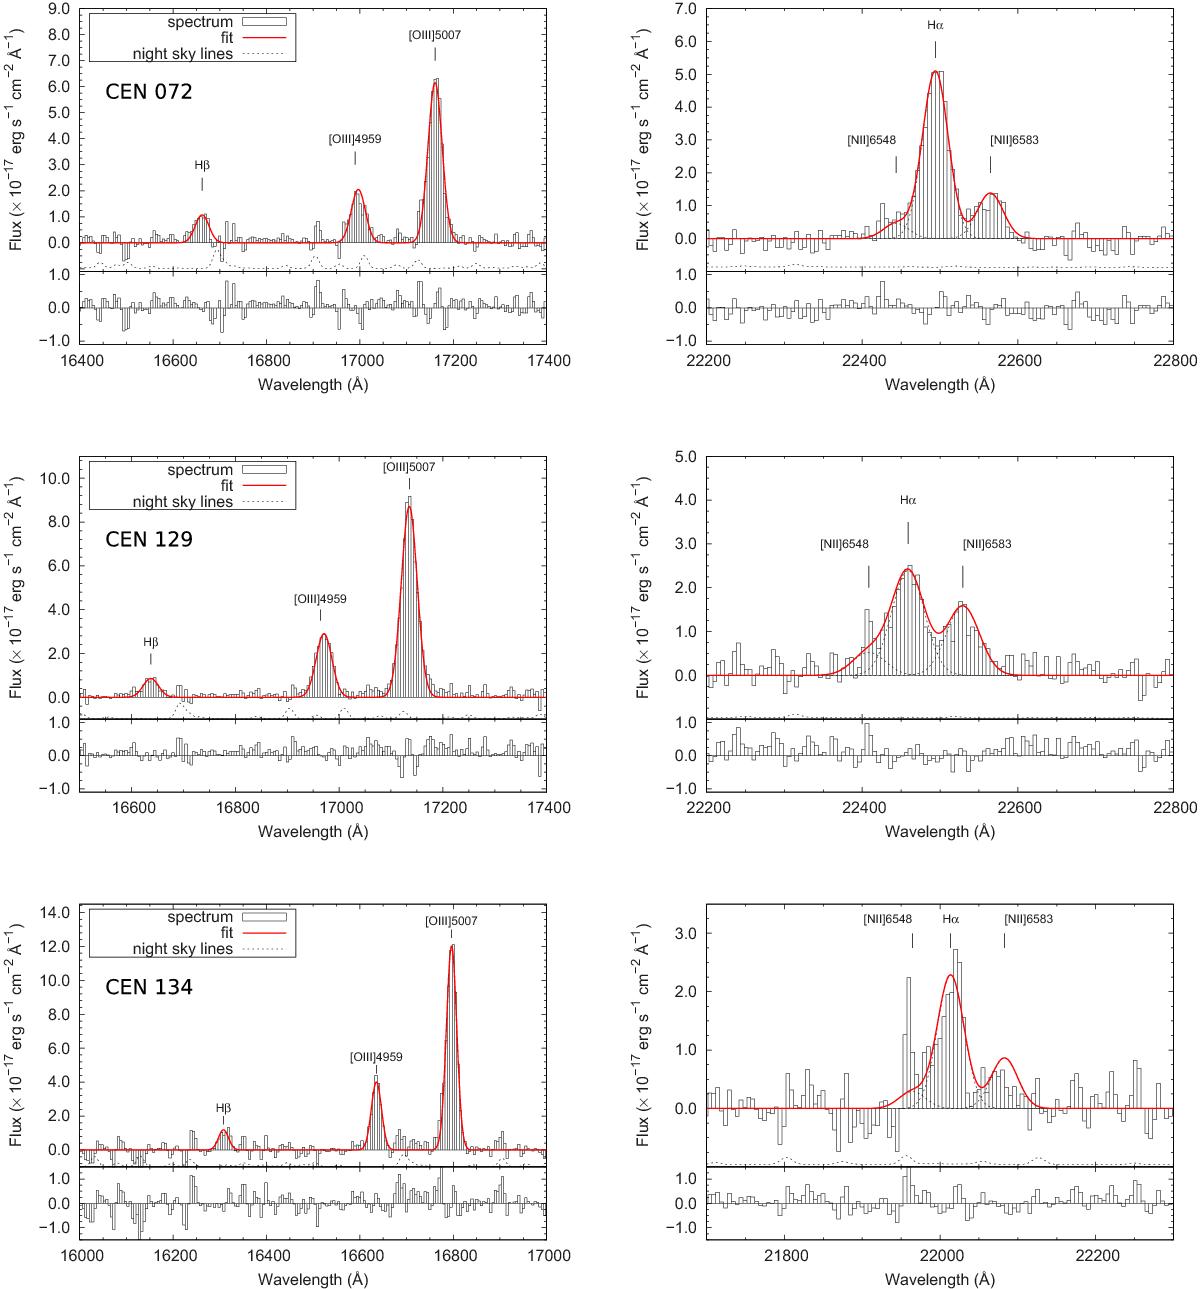
Spectra of the CENSORS sample, integrated over pixels where the [OIII] emission line is detected at SNR> 5. The left column shows spectra centered on the Hβ and [OIII] doublet emission lines and the right column is centered on the Hα + [NII] complex. All lines are well fitted by single Gaussians with the parameters listed in Table 2. Below each spectrum we show a typical night-sky spectrum to illustrate the position of bright night-sky lines (dashed lines). This spectrum is not to scale; the night-sky lines shown are typically at least factors of a few brighter than the emission lines from our targets. The bottom panel shows the fit residuals.
Current usage metrics show cumulative count of Article Views (full-text article views including HTML views, PDF and ePub downloads, according to the available data) and Abstracts Views on Vision4Press platform.
Data correspond to usage on the plateform after 2015. The current usage metrics is available 48-96 hours after online publication and is updated daily on week days.
Initial download of the metrics may take a while.