Fig. A.3
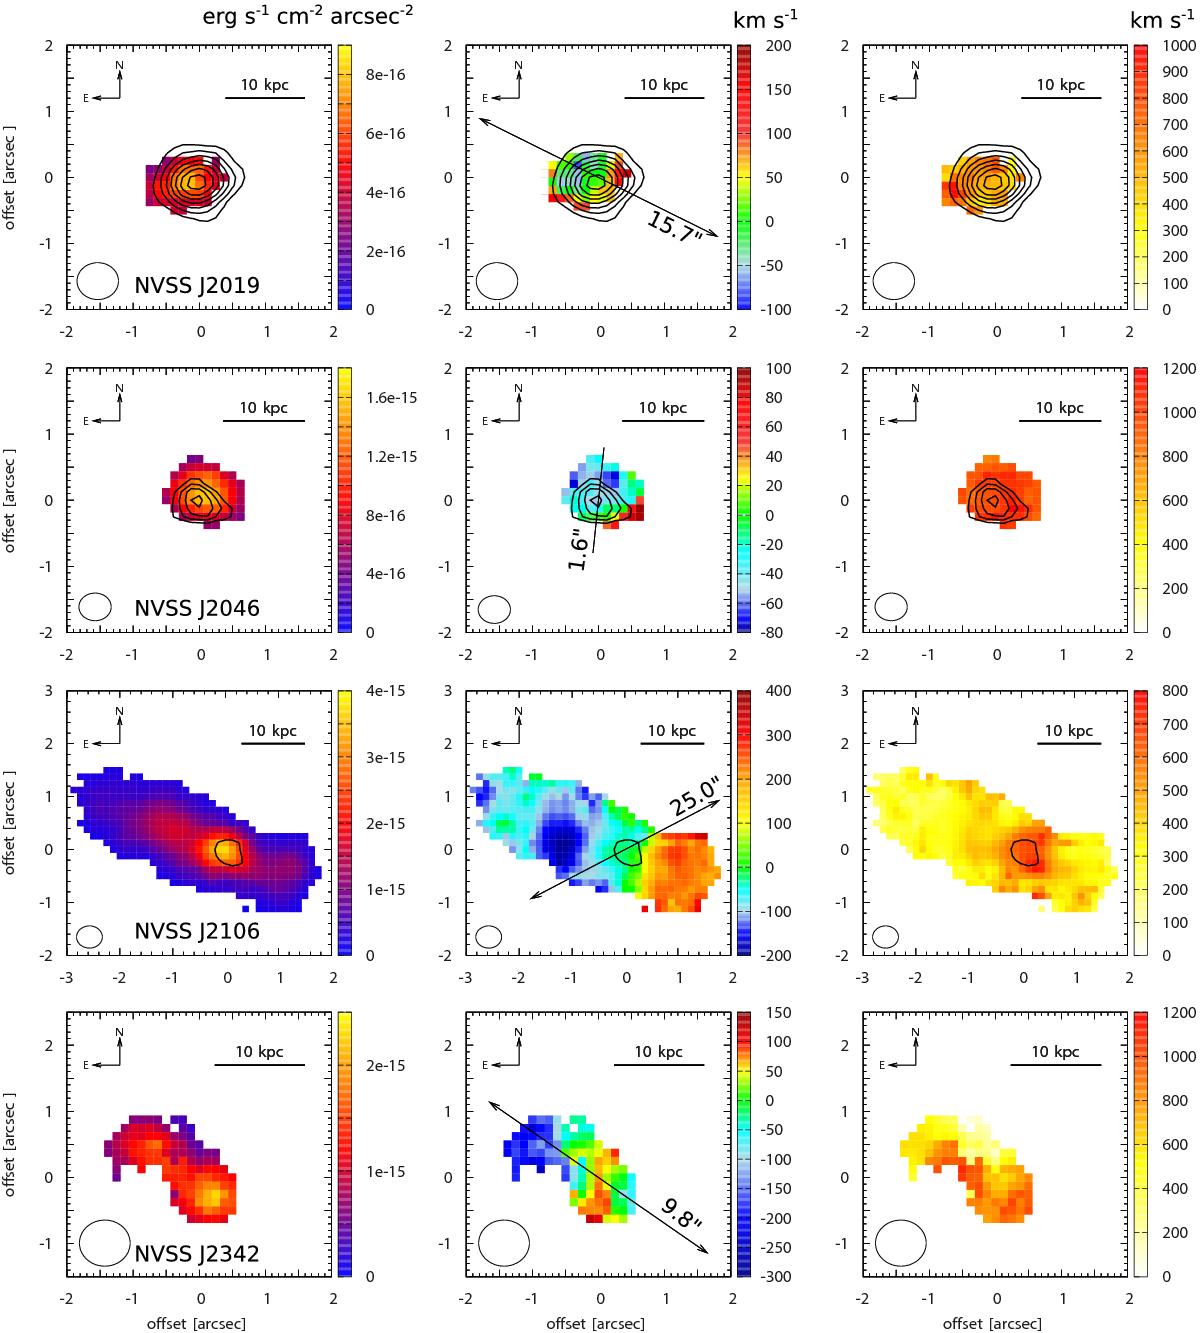
Maps of [OIII] surface brightness (left), velocity (center), and FWHM line widths (right). All maps are 4′′×4′′ wide, except for NVSS J144932−385657 and NVSS J210626−314003, where they are 5′′×5′′ wide. The circle in the bottom left represents the FWHM size of the seeing disk. Contours mark the continuum where detected. Continuum levels begin at 3σ and then increase in steps of 1σ. The solid black line in the velocity maps indicates the axis of the radio emission from our ATCA data, or from Broderick et al. (2007) if the source is compact. Numbers give the largest angular size in arcsec.
Current usage metrics show cumulative count of Article Views (full-text article views including HTML views, PDF and ePub downloads, according to the available data) and Abstracts Views on Vision4Press platform.
Data correspond to usage on the plateform after 2015. The current usage metrics is available 48-96 hours after online publication and is updated daily on week days.
Initial download of the metrics may take a while.