Free Access
Fig. 8
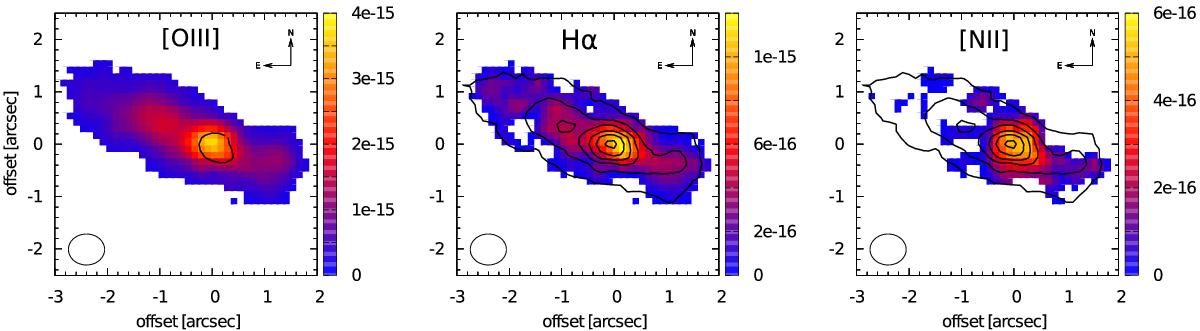
Left to right: surface brightness maps of NVSS J210626−314003 of the [OIII], Hα, and [NII]. Lines with SNR ≥ 3.0 are shown. Contours in the central and right panel show the [OIII] morphology to facilitate orientation.
Current usage metrics show cumulative count of Article Views (full-text article views including HTML views, PDF and ePub downloads, according to the available data) and Abstracts Views on Vision4Press platform.
Data correspond to usage on the plateform after 2015. The current usage metrics is available 48-96 hours after online publication and is updated daily on week days.
Initial download of the metrics may take a while.