| Issue |
A&A
Volume 585, January 2016
|
|
|---|---|---|
| Article Number | A61 | |
| Number of page(s) | 13 | |
| Section | Interstellar and circumstellar matter | |
| DOI | https://doi.org/10.1051/0004-6361/201526787 | |
| Published online | 17 December 2015 | |
Mid-IR spectra of pre-main sequence Herbig stars: An explanation for the non-detections of water lines
1
Kapteyn Astronomical Institute, Postbus 800, 9700 AV
Groningen, The
Netherlands
e-mail: antonellini@astro.rug.nl
2
SRON Netherlands Institute for Space Research,
PO Box 800, 9700 AV
Groningen, The
Netherlands
3
St. Andrews University, School of Physics and
Astronomy, St.
Andrews
KY16 9SS,
UK
4
Univ. Grenoble Alpes, IPAG, 38000
Grenoble,
France
5
Max-Planck-Institut für extraterrestrische Physisk,
Giessenbachstrasse 1,
85748
Garching,
Germany
6
Leiden Observatory, Leiden University,
PO Box 2300 RA, Leiden, The
Netherlands
7
INAF, Osservatorio Astronomico di Cagliari,
via della Scienza 5,
09047
Selargius,
Italy
8
University of Vienna, Department of Astronomy,
Türkenschanzstrasse 17,
1180
Vienna,
Austria
Received: 19 June 2015
Accepted: 23 October 2015
Context. The mid-IR detection rate of water lines in disks around Herbig stars disks is about 5%, while it is around 50% for disks around T Tauri stars. The reason for this is still unclear.
Aims. In this study, we want to find an explanation for the different detection rates between low mass and high mass pre-main-sequence stars in the mid-IR regime.
Methods. We ran disk models with stellar parameters adjusted to spectral types B9 through M2, using the radiation thermo-chemical disk modelling code ProDiMo. We explored also a small parameter space around a standard disk model, considering dust-to-gas mass ratio, disk gas mass, mixing coefficient for dust settling, flaring index, dust maximum size, and size power law distribution index. We produced convolved spectra at the resolution of Spitzer, IRS, JWST MIRI, and VLT VISIR spectrographs. We applied random noise derived from typical Spitzer spectra for a direct comparison with observations.
Results. The strength of the mid-IR water lines correlates directly with the luminosity of the central star. The models show that it is possible to suppress the water emission; however, current observations are not sensitive enough to detect mid-IR lines in disks for most of the explored parameters. The presence of noise in the spectra, combined with the high continuum flux (noise level is proportional to the continuum flux), is the most likely explanation for the non-detections towards Herbig stars.
Conclusions. Mid-IR spectra with resolution higher than 20 000 are needed to investigate water in protoplanetary disks. Intrinsic differences in disk structure, such as inner gaps, gas-to-dust ratio, dust size and distribution, and inner disk scale height, between Herbig and T Tauri star disks are able to explain a lower water detection rate in disks around Herbig stars.
Key words: protoplanetary disks / line: formation / stars: pre-main sequence / circumstellar matter
© ESO, 2015
1. Introduction
Water has been detected successfully towards many T Tauri disks in the IR (Salyk et al. 2008; Carr & Najita 2008; Pontoppidan et al. 2010a,b; Bergin et al. 2010; Hogerheijde et al. 2011; Riviere-Marichalar et al. 2012). In contrast, disks around Herbig stars do not show warm water lines in either the mid-IR (15.17, 17.22, 29.85 μm blends from Pontoppidan et al. 2010a) or the near-IR (2.9345 μm ro-vibrational lines from Fedele et al. 2011). Far-IR water lines have been detected towards the Herbig star HD 163296 (Meeus et al. 2012; Fedele et al. 2012). Tentative detections are reported towards other targets, such as HD 31648 (63 μm), HD 97048, and HD 100546, but the blend with the CH+ at 90 μm and 179.5 μm prevents any firm claim of detecting water at this wavelength (Meeus et al. 2012). Finally, six successful detections of the OH molecule have been reported from the Keck II NIRSPEC instrument towards AB Aur and MWC 758 (Mandell et al. 2008) and from CRIRES towards V380 Ori, HD 250550, HD 259431, and HD 85567 (Fedele et al. 2011).
Several possible explanations have been considered for the non-detections of water and other molecular features towards Herbig stars: veiling due to stronger continuum (Pontoppidan et al. 2010b), difference in dust content of the emitting layers (due to a different dust-to-gas mass ratio or settling, Meijerink et al. 2009), different efficiency in the heating of the surface layers, a difference in the chemistry between Herbig and T Tauri disks, or the transitional nature of the observed disks. The inner disk physical conditions seem to be independent of the mass of the central star (Salyk et al. 2008; Mandell et al. 2008), since the OH and water lines are consistent with the same gas temperature and location of the emitting regions of both T Tauri and Herbig stars. We know that some disks around Herbig stars are transitional, and in some of these, OH, CO-rovibrational and OI lines have been detected (e.g. HD 100546, Liskowsky et al. 2012). However, in some cases the inner cavity is not totally gas depleted, and transitions such as the CO-rovibrational band at 5 μm are still detectable (Salyk et al. 2009). The last hypothesis, the role of far-UV (FUV) radiation field in photodissociating water in the inner disk, seems supported by NIRSPEC & CRIRES observations of OH (respectively, Mandell et al. 2008; Fedele et al. 2011). Multi-epoch Spitzer spectra of the variable star EX Lup (Banzatti et al. 2012) support the idea that photochemistry must be responsible for organics depletion, enhanced OH column density, and reduced water column density.
Modelling of Herbig stars performed with the radiation thermo-chemical code ProDiMo (Woitke et al. 2011) suggests that disks around Herbig Ae stars are not dry and are still able to emit far-IR lines. The presence of the gaseous reservoir in the outer disk is due to an interplay between photodissociation and photodesorption. This interplay means that water vapour is present even in disks around bright stars (e.g. Herbigs, which have stronger FUV flux), but the water ice reservoir is less extended with respect to the case of disks around low mass stars (van Dishoeck et al. 2014). The inner disk water vapour reservoir is radially more extended in disks around earlier type stars (higher effective temperature, Teff, Du & Bergin 2014).
In a previous work (Antonellini et al. 2015), we investigated the effects of different disk parameters on the chemistry and water spectroscopy in the mid- and far-IR. We identified key parameters affecting the continuum opacity and the gas content of the disk as drivers of the mid- and far-IR lines. The explanation for the low detection rate of the far-IR water lines with Herschel/HIFI is very likely sensitivity; the observations were often not deep enough.
In this work, we focus on the difference between low and high mass pre-mainsequence stars (PMSs). We searched for factors that can be responsible for the absence of mid-IR water lines in disks around Herbig stars, comparing the results with what we find for T Tauri and intermediate mass PMS. We model here a different central star, inner disk properties, and instrumental properties. In Sect. 2, we describe the code and modelling approach. In Sect. 3, we report our results. In Sect. 4, we discuss the results, and finally in Sect. 5, we present our conclusions.
2. Modelling
We modelled protoplanetary disks using the radiation thermo-chemical code ProDiMo (“Protoplanetary Disk Model”) and including X-ray photoprocesses (Woitke et al. 2009; Aresu et al. 2011). The code computes the chemistry (steady state) self consistently with the heating/cooling balance. The eating processes that were implemented include PAH/photoelectric heating, C photoionization, H2 photodissociation, formation heating, and collisional de-excitation, cosmic rays heating, viscous heating, pumping by OH photodissocation, H2 pumping by formation on dust grains, and chemical heating and several others. Cooling processes occur through more than 10 000 atomic/molecular emission lines. Finally, gas and dust thermalization is also taken into account. Other features include a computation of the photo rates using detailed cross-sections and an extension of the collisional partners for water (Kamp et al. 2010), a soft-edge description of the outer disk, the polycyclic aromatic hydrocarbon (PAH) ionization balance and heating/cooling, UV fluorescence pumping, and a parametric description of settling (Woitke et al. 2011).
We computed the detailed statistical equilibrium of a subset of 500 ro-vibrational levels from the complete set (Tennyson et al. 2001; Barber et al. 2006), which includes up to 411 o-H2O and 413 p-H2O ro-vibrational levels (rotational levels up to J = 25; projections up to Ka,c = 18; vibrational levels up to v1 = 2, v2 = 2, v3 = 1). This study focuses on the 12 μm series of lines observed from the ground by Pontoppidan et al. (2010b) and also described in our previous work (Antonellini et al. 2015). In addition, we consider the blends centred at 15.17 μm observed by Spitzer IRS and reported in Pontoppidan et al. (2010a). Our line fluxes were derived from level populations computed through vertical escape probability. This approach was also used in our previous work (Antonellini et al. 2015), and it provides line fluxes that can be trusted within a factor two of a more computationally expensive detailed radiative transfer. The transitions we consider in this work are from very warm gas layers and have Eup larger than 500 K. The transitions contributing to the 12.407 μm blend have Eup> 3000 K, while the lines contributing to the 15.17 μm blend have Eup> 2700 K.
2.1. Central star
For the basic model, we use the same standard disk as in our previous work on T Tauri stars (properties are described in Table 2). We then consider different central star spectra corresponding to real observed PMS targets, including the non photospheric contributions due to accretion1 and X-rays. The spectra are built by constraining the photometric observations in the optical and the UV by fitting Teff, RV, pUV, and fUV, using literature values for the distance and Mstar (Woitke et al. 2016). We use the Kurucz and Phoenix stellar atmosphere libraries (Husser et al. 2013; Murphy & Meiksin 2004), and the high energy spectra merging IUE, HST, and FUSE observations for the FUV, and XMM-Newton and Chandra for the X-rays after a post-processing described in Dionatos et al. (in prep.). The FUV data for the stars we considered are in Appendix C.
The ten different central stars we consider are based on observed available data (Table 1). The sample includes spectral types from M2 to B9 in order to probe the effects of a different photospheric temperatures and luminosities, but also different non-photospheric contributions. The input spectra used for the code are the result of the merging of three spectral regions: photospheric (optical, near-IR, photospheric UV), UV excess, and X-rays. Each of these contributions has its own luminosity: Lstar is the photospheric luminosity, LUV the UV excess (from 3300 Å up to 1150 Å, variable from source to source), and LX the X-ray luminosity (from 5 Å up to 35 Å, variable from source to source). We check the consistency of the fitted stellar parameters with the Siess track isochrones (Siess et al. 1999)2, taking the published age of the star and the mass and verifying the consistency with the expected Teff, Lstar, and Rstar.
Central star properties.
Herbig disk grid.
2.2. Parameter space exploration of a disk around a typical Herbig star
We also built a small parameter series, exploring a subset of disk properties listed in Table 2: scale height radial power law index β, dust-to-gas mass ratio, disk gas mass, scale height of the disk at the inner disk radius, inner disk radius, mixing coefficient for the dust settling (accordingly to the settling prescription from Dubrulle et al. 1995), dust size distribution power law index, and dust grains’ maximum size. Each model contains all the quantities fixed and equal to our standard model ones, except the ones indicated in Table 2. A more detailed description of the previous disk properties can be found in Antonellini et al. (2015). This kind of exploration allows us to disentangle the effects of single parameters on disks irradiated by a central Herbig star. In this small parameter series, the disk is irradiated by a typical Herbig star (2.2 M⊙, 32 L⊙, 8600 K). The disk we considered is the same as the standard disk model of our previous work (Antonellini et al. 2015), with the exception of the inner radius, which is computed consistently with the sublimation temperature of the dust (Rin = 0.365 au; Table 2).
3. Results
3.1. Series 1: Different central star
The general trend is shown in Fig. 1, where the flux of the 12.407 μm water blend is plotted for our models with different central stars. The mid-IR transitions get stronger with increasing photospheric temperature, although the progression is not linear. This can be explained by a combination of different stellar spectrum properties (e.g. hardness of the X-ray component, colour of the FUV excess), which can affect the heating/cooling and/or water abundance in the inner reservoir in a complex manner. In a previous study, Aresu et al. (2012) explored the effect of X-rays on far-IR water lines, finding that the 179 μm flux grows with LX independently from the UV. The situation becomes more complex when analysing transitions produced in the inner disk. There is an LUV threshold above which X-ray affects the far-IR water line fluxes. In our previous work (Antonellini et al. 2015), we found that mid-IR transitions originate in regions in which water is produced by thermally activated channels and depleted by photodissocation. The spectroscopy in this region is affected by FUV radiation. Overall, the line flux of the mid-IR lines correlates with the stellar bolometric luminosity (Fig. 2), and it is correlated with the FUV and uncorrelated with X-ray luminosities (blue and magenta symbols in the same plot). However, the sample of stellar spectra studied is too small to go into a deeper analysis.
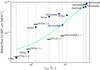 |
Fig. 1 Line fluxes and luminosities from the central star versus effective temperature for the Spitzer 12.407 μm blend. The blue dots are the line fluxes of the models for the different central stars. The stars indicate the luminosities in the different wavelength bands. Detection limits for Spitzer IRS observations towards the same central star disks are plotted as thick green dashes (see Appendix A). Light green curve shows a fit to the sensitivity limits. The central stars are labelled with the name reported in Col. 1 of Table 2. |
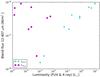 |
Fig. 2 Line fluxes for Spitzer 12.407 μm blend versus LFUV (stars cyan) and LX (magenta exagons). |
The theoretical Spitzer spectra (Fig. 3) predict that the earliest spectral types have a richer mid-IR spectrum. A zoom into the 12 μm region shows that the trend is not dictated only by the spectral type: DN Tau (K6V) and CY Tau (M2V) are the only two objects with Lstar< 1L⊙ (and FUV less than 5% of the bolometric), and they show weaker mid-IR water lines. For example, the M2V spectral type star (Lstar = 0.4L⊙) 12.407 μm flux is a factor 17 weaker than the M6 case (Lstar = 1.3L⊙). This suggests again that the bolometric luminosity is the real driving force behind the mid-IR spectroscopy.
From Spitzer IRS observations towards the central stars, that we modelled (blue dots with thick green dashes in Fig. 1), we find that the sensitivity anticorrelates with the stellar luminosity, indicating that observations around brighter stars are less sensitive. The sensitivity limit for HD 163296 (Spectral type A4) in Spitzer spectra is very close to our standard disk model generated for the spectral type A4 (HD 163296 in Fig. 1). The disk structure around this Herbig star has been robustly fitted by Tilling et al. (2012) using multi-wavelength observations, and it is very similar to our standard disk model. This may point to the fact that observations for this object were simply not deep enough to detect the mid-IR water lines.
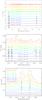 |
Fig. 3 Theoretical Spitzer SH/LH spectra (convolved at R = 600 and rebinned) for models with different central stars; full continuum subtracted spectrum, artificially shifted for all the models (top); zoom on the 12 μm region (middle); zoom on the 26.5 μm region (bottom). |
The modelled IRS spectra for different central stars seem to disagree with the observations towards a large sample of Herbig stars whose spectra are featureless (Pontoppidan et al. 2010a). The are two reasons for the disagreement between observations and modelling: either the structure of Herbig disks is different from T Tauri disks or instrumental effects affect the spectra of these two types of PMS disks differently. In the next two paragraphs, we test the first hypothesis comparing the result of modelling with observations, and then we apply instrumental characteristics to test the second hypothesis.
3.2. Series 2: Rockline displacement effect
The results from the standard disk irradiated by a different central star contain an inconsistency (since we wanted to isolate the effect of a changing central star from that of disk changes). The inner disk radius remains fixed at 0.1 au. Taking 1500 K instead as the sublimation temperature for the dust (silicates) as adopted in Min et al. (2011), Fig. 4 shows how the disk inner radius is shifted outwards for earlier type stars. For T Tauri stars with Lstar< 1.5L⊙, the inner radius is even truncated inward of 0.1 au.
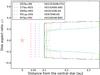 |
Fig. 4 Rockline position for the disks around different central stars. The thick black line indicates the disk contour at the gas density of 5 × 103 cm-3 for all our disk models, and we consider it as delimitation of our disk, because the erosion happens at more then 4 disk scale heights. The different colour and line styles delimit the contours of the disk with Tdust = 1500 K assumed as sublimation temperature of silicates. Upward and inward of this contour, the dust is sublimated, and the disk is truncated. It describes the effective extension of the disk according to the dust sublimation temperature. For late type stars, disk temperatures are too low, and the contour is replaced by a vertical line that indicates the distance from which the dust in thermal equilibrium should be photoevaporated. The position of the central star is indicated by the star symbol. |
To study the impact of a disk truncated by dust sublimation, we ran a series of models considering different disk inner radii and another series of models with different scale heights always using the same central star, a typical Herbig star (see Notes of Table. 2). The larger inner disk radii produce a suppression of the whole mid-IR spectrum, in particular if the gap extends beyond 10 au (Fig. 5). For inner radii less than 1.0 au, the Spitzer features become weaker again from a geometrical effect: the line is emitted further inwards, and the total emitting area becomes smaller. Increasing the scale height of the same disk will strongly reduce the continuum opacity. As a consequence, the water ice reservoir is totally depleted and the water-vapour reservoir is radially more extended (in particular the innermost one). The emitting water column density increases and mid-IR water lines become stronger. This is particularly true for disks with a scale height larger than 2 × 10⁻³ au at R = 0.1 au.
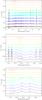 |
Fig. 5 Continuum-subtracted theoretical Spitzer spectra for Rin variation, artificially shifted, convolved at the resolution of R = 600, and rebinned. The second plot is a zoom of the complete spectrum for the 12 μm region. The third plot is a zoom on the 26.5 μm region. |
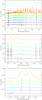 |
Fig. 6 Continuum-subtracted theoretical Spitzer spectra for H0 variation, artificially shifted, convolved at the resolution of R = 600, and rebinned. The second plot is a zoom of the complete spectrum on the 12 μm region. The third plot is a zoom on the 26.5 μm region. |
The true rockline displacement is limited to few tenth of astronomical unit, and the lowering in scale height is about a factor 2 with respect to our standard disk for the brightest Herbig star we considered (Fig. 4). To suppress the Spitzer water line emission, it would be necessary to open a gap larger than 5–10 au and contract the disk vertically by more than a factor 2. In particular, the 15.17 μm blend drops below the typical sensitivity range we defined for Spitzer IRS observations of Herbig stars (8 × 10-17–8 × 10-18 W/m2) for Rin> 20 au and H0 smaller than 9 × 10⁻³ au. This numerical test rules out that a simple difference in the disk structure is responsible for the water non-detections towards Herbig disks.
3.3. Series 3: Extended parameter space exploration
For a direct comparison with Spitzer observations of Herbig disks, we expand the parameter space exploring also the dust-to-gas mass ratio, the flaring index, the gas mass, the C/O ratio, the settling (through the αset turbulent coefficient from Dubrulle et al. 1995), and the dust maximum size and power law distribution (apow), around the typical central Herbig star (Sect. 2). Fluxes extracted for mid-IR water blends at 15.17 μm (Pontoppidan et al. 2010a) are compared to the results from our series of models. As mid-IR continuum tracer, we used the same ratio as considered in our previous work (13.5/30 μm, Antonellini et al. 2015). Figure 7 shows the same plot as for the T Tauri disk model series (Fig. 13 top panel, Antonellini et al. 2015). In our previous paper we showed that the transitions contributing to this blend behave in the same manner as our representative 12.407 μm line, and the same holds for the blends at 17 and 29 μm. Any conclusion on this blend will be representative of the entire mid-IR water spectrum.
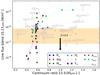 |
Fig. 7 Herbig parameter space for the water line blend at 15.17 μm. In the plot the data points (all upper limits, in grey) are from Pontoppidan et al. (2010a). All the fluxes are scaled to 140 pc. The shaded yellow area contains the range of sensitivity we retrieved from the Spitzer spectra of Herbig stars HD 135344B and HD 100546. All the fluxes of the disks considered are scaled to 140 pc. The trend toward disks being flatter than β = 0.8 is shown with a black arrow, since models that are too flat will be self-shadowed, and the derived mid-IR colour cannot be compared in a trustworthy manner with observations, in which the shadowing can be partial owing to a more complex disk structure. |
The standard Herbig star disk, which is the base model of the parameter space exploration (Table 2) is located in the central part of Fig. 7, where all the model series intersect. We notice that a certain fraction of the targets and of our parameter space study is below the range of detection threshold deduced from the sensitivity limits reported in Fig. 1. Part of the targets that would be detectable at 140 pc are too distant, and the exposure time length was not optimal for these objects. That our typical Herbig model is close to the sensitivity range in Fig. 7 suggests that instrumental factors may have played an important role in the chance of detecting water lines in Spitzer IRS observations.
3.4. Instrumental effects
The previous discussion is based on spectra unaffected by instrumental noise. Observations of water towards disks in the mid-IR wavelength range have been performed with the Spitzer Space Telescope and from the ground with the VLT (e.g. Pontoppidan et al. 2010b). The future of near- and mid-IR water studies is James Webb Space Telescope (JWST). To take instrumental effects into account, we rebinned our oversampled modelled spectra and applied random noise effects (see Appendix B) to the convolved spectra (Spitzer R = 600, Houck et al. 2004).
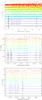 |
Fig. 8 Theoretical Spitzer SH/LH spectra (R = 600) for models with different central stars rebinned and noisy; full continuum-subtracted spectrum, artificially shifted for all the models (top), zoom on the 12 μm region (middle), zoom on the 26.5 μm region (bottom). |
The rebinning procedure and the application of the random noise to the central stars models (Fig. 8) have the effect of suppressing the water line fluxes in the mid-IR spectra. The effect is particularly dramatic for the earlier type stars, since they show a stronger continuum, hence stronger noise. The possibility of using space- or ground-based instruments (in the mid-IR windows) with higher spectral resolution and sensitivity would increase the detections of spectral features in the mid-IR towards both Herbig and T Tauri stars.
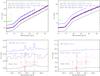 |
Fig. 9 Theoretical spectra convolved and re-binned at different resolutions (Spitzer, IRS, R = 600; JWST MIRI, R = 3000 at 5.5 μm; VLT VISIR, R = 25 000), and zoom in the 26 μm region. The ranges adopted are the same as the instruments spectrographs. VISIR is ground-based, and the main limits are due to atmospheric transmission: we plotted only the region in which the transmissivity is ≥80%. The Spitzer spectrum with noise is also plotted in magenta. The strong feature at 12.93 μm in the VISIR modelled spectrum of a T Tauri star disk is due to H2 (J = 7−6, v = 0). Water lines contributing to the blends at 26 μm are indicated by vertical red arrows. |
Theoretical spectra of the global mid-IR spectrum and some zoom on two regions (12.4 μm and 26.6 μm) convolved at the resolutions of Spitzer IRS (Houck et al. 2004), JWST MIRI (Clampin 2011) and VISIR on VLT (Lagage et al. 2000; see Appendix B), are plotted in Fig. 9. The plot shows that the improvement due to higher spectral resolution will allow detection of unblended water transitions with a larger line/continuum ratios. The resolution of JWST/MIRI will improve the detection rate, but the gain is potentially still too low for Herbig stars, and higher resolution (R ≫ 3000) is needed. The comparison between Herbig and T Tauri disks shows that the features are stronger for the earlier type objects (see Fig. 3), but the lines are also buried in a stronger continuum. The related stronger noise then makes the water lines even more difficult to detect for Herbig PMS stars. T Tauri disks show weaker water line fluxes, but the lower continuum translates into a lower noise and so into a higher detection rate. This agrees with the more successful detection of mid-IR water blends towards T Tauri stars (about 50%).
3.5. Near-IR ro-vibrational water lines
As a sanity check of the quality of our models, we computed the predicted line flux for a ro-vibrational water transition at 2.934 μm (Fig. 10) targeted by Fedele et al. (2011). Our models, in agreement with the observations, predict that this ro-vibrational line should be undetectable in both T Tauri and Herbig star disks, owing to the sensitivity limits of the CRIRES spectrograph on the VLT (Kaeufl et al. 2004).
4. Discussion
In this work, we investigate a couple of explanations for the non detection of mid-IR water towards more massive PMSs, based on modelling physics and capabilities. The real disks can be more complex than the parametrized models studied here. In the following sections, we address the possible explanations for the low water detection rate in Spitzer spectra of Herbig stars individually.
4.1. Modelling assumptions
We consider here parametrized disk structures with monotonic shapes and radial mass distributions. Several previous studies have pointed out that the stronger irradiation from a hotter central star should produce a puffed-up inner disk (e.g. Dullemond 2002). Observations towards some Herbig stars disks suggest that this scenario could be common (e.g. HD 163296, HD 141569A, and HD 150193A; Garufi et al. 2014b). This change in the inner disk is able to cast strong shadows, but apparently from hydrostatic modelling it is not enough to produce lower temperatures in the inner few astronomical units (Meijerink et al. 2012), so mid-IR line fluxes should not be affected.
Our code is able to compute hydrostatic equilibrium disks, but we are limited by the heating/cooling processes implemented, and the results tend towards a maximum flaring angle (Meijerink et al. 2012), which is generally not seen in detailed fitting results of individual objects (e.g. Tilling et al. 2012; Garufi et al. 2014a). The hydrostatic assumption itself is a limitation since it suppresses winds in disks, and this aspect is in conflict with the theory on photoevaporation (e.g. Hollenbach et al. 1994).
The rockline displacement in disks around bright PMSs is not large enough to explain the water non-detections. Our models suggest that in order to suppress the mid-IR water spectra, it is necessary to open a gap larger than 20 au or to lower the disk scale height below 10-3 au in the inner disk within 0.5 au. From a recent near-IR interferometry survey of Herbig stars, about 5% of the objects are consistent with a gap larger than 20 au (Menu et al. 2015).
4.2. Intrinsic disk physics
Following the outcome of the first series of models, we performed a parameter space exploration to understand whether physical differences between low and high mass PMSs disks could be an explanation for the non-detections. We found that indeed several properties are able to suppress the mid-IR water lines below the typical sensitivity range we considered (8 × 10-17−8 × 10-18 W/m2): very low disk scale height, large gaps (see previous section), and high dust opacity (due to high dust content or grain size). These results agree with our previous results for T Tauri stars.
Then the standard model we took as fiducial case of a typical disk surrounding an Herbig star is also very close to the sensitivity range. The observations of Herbig stars overplotted on the parameter space explored, shows that disks largely populate the region we explore, and several objects could in principle have been detected only if they were close enough. In Pontoppidan et al. (2010a), we found that many of these targets were at distances greater than 220 pc. Again our model seems consistent with the observations. From our results, we are not able to exclude intrinsic differences in disks around Herbig stars with respect to lower mass PMS stars. However, observations from Acke et al. (2009) conclude that 50% of the Herbig stars analysed show scale heights enlarged by a factor 2 or 3 with respect to hydrostatic prediction. This strongly puffed-up inner region is able to cast a shadow that makes the disk cooler, as for HD 95881 (Verhoeff et al. 2010), possibly also for HD 144432 (Chen et al. 2012), and finally HD 163296 and HD 150193A (Garufi et al. 2014b). Then recent continuum radiative transfer modelling suggests that the mid-IR emitting regions of disks around different PMS stars (from brown dwarfs through Herbigs) are self-similar in surface density, vertical distribution of dust and gas, and grain size distribution (Mulders & Dominik 2012).
4.3. Instrumental noise
Finally we consider the instrumental noise that is able to affect the detection rate towards bright PMSs disks. Our study suggests that the low resolution and sensitivity of Spitzer IRS is the main cause of mid-IR water non-detections in disks around Herbig stars. Mid-IR lines are buried in a stronger continuum and in the corresponding larger noise. We consider here a linear relation between noise and continuum, which is a conservative criterium. Pattern noise and fringing3 produce systematically stronger noise at high signal levels (i.e. for stronger continuum, Fig. 11). This noise can be reduced by adopting deeper integration or multiple integration cycles. The observations analysed in Pontoppidan et al. (2010a) were deep enough for a relevant number of T Tauri stars, but not for Herbig stars.
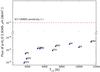 |
Fig. 10 p-H2O 2.394 μm ro-vibrational line prediction from models with a different central star. Typical sensitivity limits from the observations in Fedele et al. (2011; 10–40 min exposure) are shown as a red dashed line. |
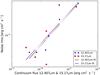 |
Fig. 11 Noise level versus continuum flux at the wavelengths of 12.407 μm (blue dots) and 15.17 μm (red squares). Overplotted are the fit to the data, green for 12.407 μm and magenta for the 15.17 μm. |
Higher spectral resolution is needed to investigate water and likely other weaker mid-IR lines in disks around early type PMS stars, overcoming noise and integration time problems. JWST/MIRI will already unblend several Spitzer water lines and will allow a better line/continuum ratio, but this could not be still high enough for Herbig stars. Ground-based facilities with spectral resolution >20 000 (like VISIR on VLT) are needed to improve the detection of water towards a wider sample of Herbig stars. However, ground-based observations will always be limited in wavelength coverage (and excitation temperatures) owing to atmospheric transmission and telluric lines, and would limit the detections to some energetic rotational transitions such as the 12.4 μm blend observed in Pontoppidan et al. (2010a).
5. Conclusions
From the outcome of our model, we have provided a scenario that can explain the observations in the mid-IR towards a Herbig star: we considered some limitations in our description of disks around Herbig stars, and we think that these would not be problematic for the correct physical description of the mid-IR spectroscopy.
Observations have been performed up to now with facilities affected by low spectral resolution and lower sensitivity. These two elements limit any possible firm conclusion about the nature of disks around Herbig stars, which can be intrinsically different from the ones surrounding T Tauri stars. Low signal-to-noise ratio (S/N) is the most likely explanation for the low detection rates of mid-IR water lines around early type PMSs. This problem also partially affects later type PMSs. T Tauri stars spectra are less noisy; however, mid-IR water line fluxes are lower, and the detection rate is only a factor two more than for Herbig stars. Better performing instruments with resolution >3000 and longer integration times are definitively needed to detect water successfully in the 1–20 μm range in protoplanetary disks.
Appendix A: Sensitivity limits
Our analysis sample includes a selection of T Tauri and Herbig Spitzer IRS high resolution observations. BCD data products were retrieved from the Spitzer archive4. The data were reduced with the c2d IRS science pipeline using the PSF extraction method (see Lahuis et al. 2007; Lahuis 2007, for details), which provides higher S/N spectra than the standard tapered aperture extraction used to populate the Spitzer archive. After extraction, additional defringing (Lahuis & Boogert 2003) was applied to remove any low-level fringe residuals.
Sensitivity limits were determined by calculating the line flux for synthetic lines with an amplitude equivalent to the 1σ noise level in the IRS spectrum at the respective blend wavelengths and a width comparable to the blend width at a spectral resolution of 600.
Appendix B: Spectral convolution
We applied Gaussian convolution and rebinning to the theoretical spectra from our models.
For this task we used the ISO spectral analysis package (Kessler et al. 1996), considering the three resolutions of Spitzer
IRS LH/SH modules (R =
600; Houck et al. 2004), VLT VISIR
(R = 25 000;
Lagage et al. 2000). For JWST MIRI we split the
range into four spectral windows: R = 2800 for 7.63–11.71 μm, R = 2500 for 11.71–13.59
μm,
R = 2300 for
13.59–18.14 μm,
R = 1600 for
18.14–28.43 μm,
accounting for the variable spectral resolution (Clampin
2011). We add noise through a random generator according to ![\appendix \setcounter{section}{2} \begin{equation} \label{(1)} \centering N = F_\mathrm{cont}\cdot \frac{U([0,1])}{100} \end{equation}](/articles/aa/full_html/2016/01/aa26787-15/aa26787-15-eq129.png) (B.1)\newpage
(B.1)\newpage
where N is the computed noise and a function both of the continuum flux (Fcont) multiplied for a random generator between 0 and 1 (U( [ 0,1 ])) and of the selected S/N. Here we consider 100 as claimed in Pontoppidan et al. (2010a).
Appendix C: Far-UV spectra
Far-UV spectra data source, and number of epochs for each source.
FUV data are produced by combining observations from IUE, FUSE, HST/STIS, HST/COS, and when available, HST/ACS archival data (Fig. C.1). These data were taken in multiple observations of the same objects, and they have different resolution, integration time, spectral range, and noise. Owing to the complex dataset, the best spectra we use is an average performed through a sophisticated procedure described in detail in Dionatos et al. (in prep.).
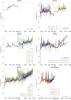 |
Fig. C.1 Far-UV component for each of the stars we modelled. The black line is the best fit of the multiple epochs of observations. Spectra data points are colour-coded, and the original files are labelled. |
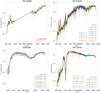 |
Fig. C.1 continued. |
Acknowledgments
The research leading to these results has received funding from the European Union Seventh Framework Programme FP7-2011 under grant agreement No. 284405
References
- Acke, B., Min, M., van den Ancker, M. E., et al. 2009, A&A, 502, L17 [NASA ADS] [CrossRef] [EDP Sciences] [Google Scholar]
- Antonellini, S., Kamp, I., Riviere-Marichalar, P., et al. 2015, A&A, 582, A105 [NASA ADS] [CrossRef] [EDP Sciences] [Google Scholar]
- Ardila, D. R., Golimowski, D. A., Krist, J. E., et al. 2007, ApJ, 665, 512 [NASA ADS] [CrossRef] [Google Scholar]
- Aresu, G., Kamp, I., Meijerink, R., et al. 2011, A&A, 526, A163 [NASA ADS] [CrossRef] [EDP Sciences] [Google Scholar]
- Aresu, G., Meijerink, R., Kamp, I., et al. 2012, A&A, 547, A69 [NASA ADS] [CrossRef] [EDP Sciences] [Google Scholar]
- Banzatti, A., Meyer, M. R., Bruderer, S., et al. 2012, ApJ, 745, 90 [NASA ADS] [CrossRef] [Google Scholar]
- Barber, R. J., Tennyson, J., Harris, G. J., & Tolchenov, R. N. 2006, MNRAS, 368, 1087 [NASA ADS] [CrossRef] [Google Scholar]
- Bergin, E. A., Hogerheijde, M. R., Brinch, C., et al. 2010, A&A, 521, L33 [NASA ADS] [CrossRef] [EDP Sciences] [Google Scholar]
- Bertout, C., Siess, L., & Cabrit, S. 2007, A&A, 473, L21 [NASA ADS] [CrossRef] [EDP Sciences] [Google Scholar]
- Carmona, A., Pinte, C., Thi, W. F., et al. 2014, A&A, 567, A51 [NASA ADS] [CrossRef] [EDP Sciences] [Google Scholar]
- Carr, J. S., & Najita, J. R. 2008, Science, 319, 1504 [NASA ADS] [CrossRef] [PubMed] [Google Scholar]
- Chen, L., Kreplin, A., Wang, Y., et al. 2012, A&A, 541, A104 [NASA ADS] [CrossRef] [EDP Sciences] [Google Scholar]
- Clampin, M. 2011, in SPIE Conf. Ser., 8146 [Google Scholar]
- Donati, J.-F., Gregory, S. G., Alencar, S. H. P., et al. 2013, MNRAS, 436, 881 [NASA ADS] [CrossRef] [Google Scholar]
- Draine, B. T., & Lee, H. M. 1984, ApJ, 285, 89 [Google Scholar]
- Du, F., & Bergin, E. A. 2014, ApJ, 792, 2 [NASA ADS] [CrossRef] [Google Scholar]
- Dubrulle, B., Morfill, G., & Sterzik, M. 1995, Icarus, 114, 237 [NASA ADS] [CrossRef] [Google Scholar]
- Dullemond, C. P. 2002, A&A, 395, 853 [NASA ADS] [CrossRef] [EDP Sciences] [Google Scholar]
- Ellerbroek, L. E., Podio, L., Dougados, C., et al. 2014, A&A, 563, A87 [NASA ADS] [CrossRef] [EDP Sciences] [Google Scholar]
- Fedele, D., Pascucci, I., Brittain, S., et al. 2011, ApJ, 732, 106 [NASA ADS] [CrossRef] [Google Scholar]
- Fedele, D., Bruderer, S., van Dishoeck, E. F., et al. 2012, A&A, 544, L9 [Google Scholar]
- Fedele, D., Bruderer, S., van Dishoeck, E. F., et al. 2013, A&A, 559, A77 [NASA ADS] [CrossRef] [EDP Sciences] [Google Scholar]
- Garcia Lopez, R., Natta, A., Testi, L., & Habart, E. 2006, A&A, 459, 837 [NASA ADS] [CrossRef] [EDP Sciences] [Google Scholar]
- Garufi, A., Podio, L., Kamp, I., et al. 2014a, A&A, 567, A141 [NASA ADS] [CrossRef] [EDP Sciences] [Google Scholar]
- Garufi, A., Quanz, S. P., Schmid, H. M., et al. 2014b, A&A, 568, A40 [NASA ADS] [CrossRef] [EDP Sciences] [Google Scholar]
- Hartigan, P., Edwards, S., & Ghandour, L. 1995, ApJ, 452, 736 [NASA ADS] [CrossRef] [Google Scholar]
- Hogerheijde, M. R., Bergin, E. A., Brinch, C., et al. 2011, Science, 334, 338 [NASA ADS] [CrossRef] [PubMed] [Google Scholar]
- Hollenbach, D., Johnstone, D., Lizano, S., & Shu, F. 1994, ApJ, 428, 654 [NASA ADS] [CrossRef] [Google Scholar]
- Houck, J. R., Roellig, T. L., van Cleve, J., et al. 2004, ApJS, 154, 18 [NASA ADS] [CrossRef] [Google Scholar]
- Husser, T.-O., Wende-von Berg, S., Dreizler, S., et al. 2013, A&A, 553, A6 [NASA ADS] [CrossRef] [EDP Sciences] [Google Scholar]
- Kaeufl, H.-U., Ballester, P., Biereichel, P., et al. 2004, in Ground-based Instrumentation for Astronomy, eds. A. F. M. Moorwood, & M. Iye, SPIE Conf. Ser., 5492, 1218 [Google Scholar]
- Kamp, I., Tilling, I., Woitke, P., Thi, W.-F., & Hogerheijde, M. 2010, A&A, 510, A18 [NASA ADS] [CrossRef] [EDP Sciences] [Google Scholar]
- Kessler, M. F., Steinz, J. A., Anderegg, M. E., et al. 1996, A&A, 315, L27 [NASA ADS] [Google Scholar]
- Lagage, P.-O., Durand, G. A., Lyraud, C., et al. 2000, in Optical and IR Telescope Instrumentation and Detectors, eds. M. Iye, & A. F. Moorwood, SPIE Conf. Ser., 4008, 1120 [Google Scholar]
- Lahuis, F. 2007, Ph.D. Thesis, Leiden Observatory, Leiden University, The Netherlands [Google Scholar]
- Lahuis, F., & Boogert, A. 2003, in SFChem 2002: Chemistry as a Diagnostic of Star Formation, proceedings of a conference held August 21–23, 2002, at University of Waterloo, Waterloo, Ontario, Canada N2L 3G1, eds. C. L. Curry, & M. Fich, 335 [Google Scholar]
- Lahuis, F., van Dishoeck, E. F., Blake, G. A., et al. 2007, ApJ, 665, 492 [NASA ADS] [CrossRef] [Google Scholar]
- Liskowsky, J. P., Brittain, S. D., Najita, J. R., et al. 2012, ApJ, 760, 153 [NASA ADS] [CrossRef] [Google Scholar]
- López-Martínez, F., & Gómez de Castro, A. I. 2014, MNRAS, 442, 2951 [NASA ADS] [CrossRef] [Google Scholar]
- Luhman, K. L., Allen, P. R., Espaillat, C., Hartmann, L., & Calvet, N. 2010, ApJS, 186, 111 [NASA ADS] [CrossRef] [Google Scholar]
- Maaskant, K. M., Min, M., Waters, L. B. F. M., & Tielens, A. G. G. M. 2014, A&A, 563, A78 [NASA ADS] [CrossRef] [EDP Sciences] [Google Scholar]
- Mandell, A. M., Mumma, M. J., Blake, G. A., et al. 2008, ApJ, 681, L25 [NASA ADS] [CrossRef] [Google Scholar]
- Manset, N., Bastien, P., Ménard, F., et al. 2009, A&A, 499, 137 [NASA ADS] [CrossRef] [EDP Sciences] [Google Scholar]
- McJunkin, M., France, K., Schneider, P. C., et al. 2014, ApJ, 780, 150 [NASA ADS] [CrossRef] [Google Scholar]
- Meeus, G., Montesinos, B., Mendigutía, I., et al. 2012, A&A, 544, A78 [NASA ADS] [CrossRef] [EDP Sciences] [Google Scholar]
- Meijerink, R., Pontoppidan, K. M., Blake, G. A., Poelman, D. R., & Dullemond, C. P. 2009, ApJ, 704, 1471 [NASA ADS] [CrossRef] [Google Scholar]
- Meijerink, R., Aresu, G., Kamp, I., et al. 2012, A&A, 547, A68 [NASA ADS] [CrossRef] [EDP Sciences] [Google Scholar]
- Menu, J., van Boekel, R., Henning, T., et al. 2015, A&A, 581, A107 [NASA ADS] [CrossRef] [EDP Sciences] [Google Scholar]
- Min, M., Dullemond, C. P., Kama, M., & Dominik, C. 2011, Icarus, 212, 416 [NASA ADS] [CrossRef] [Google Scholar]
- Mulders, G. D., & Dominik, C. 2012, A&A, 539, A9 [NASA ADS] [CrossRef] [EDP Sciences] [Google Scholar]
- Müller, A., van den Ancker, M. E., Launhardt, R., et al. 2011, A&A, 530, A85 [NASA ADS] [CrossRef] [EDP Sciences] [Google Scholar]
- Murphy, T., & Meiksin, A. 2004, MNRAS, 351, 1430 [NASA ADS] [CrossRef] [Google Scholar]
- Perryman, M. A. C., Lindegren, L., Kovalevsky, J., et al. 1997, A&A, 323, L49 [NASA ADS] [Google Scholar]
- Pontoppidan, K. M., Salyk, C., Blake, G. A., & Käufl, H. U. 2010a, ApJ, 722, L173 [NASA ADS] [CrossRef] [Google Scholar]
- Pontoppidan, K. M., Salyk, C., Blake, G. A., et al. 2010b, ApJ, 720, 887 [NASA ADS] [CrossRef] [Google Scholar]
- Riviere-Marichalar, P., Ménard, F., Thi, W. F., et al. 2012, A&A, 538, L3 [NASA ADS] [CrossRef] [EDP Sciences] [Google Scholar]
- Salyk, C., Pontoppidan, K. M., Blake, G. A., et al. 2008, ApJ, 676, L49 [NASA ADS] [CrossRef] [Google Scholar]
- Salyk, C., Blake, G. A., Boogert, A. C. A., & Brown, J. M. 2009, ApJ, 699, 330 [NASA ADS] [CrossRef] [Google Scholar]
- Siess, L., Forestini, M., & Bertout, C. 1999, A&A, 342, 480 [NASA ADS] [Google Scholar]
- Tennyson, J., Zobov, N. F., Williamson, R., Polyansky, O. L., & Bernath, P. F. 2001, J Phys. Chem. Reference Data, 30, 735 [Google Scholar]
- Tilling, I., Woitke, P., Meeus, G., et al. 2012, A&A, 538, A20 [NASA ADS] [CrossRef] [EDP Sciences] [Google Scholar]
- van Boekel, R., Min, M., Waters, L. B. F. M., et al. 2005, A&A, 437, 189 [NASA ADS] [CrossRef] [EDP Sciences] [Google Scholar]
- van den Ancker, M. E., The, P. S., Tjin A Djie, H. R. E., et al. 1997, A&A, 324, L33 [NASA ADS] [Google Scholar]
- van Dishoeck, E. F., Bergin, E. A., Lis, D. C., & Lunine, J. I. 2014, Protostars and Planets VI, 835 [Google Scholar]
- van Leeuwen, F., ed. 2007, in Hipparcos, the New Reduction of the Raw Data, Astrophys. Space Sci. Libr., 350 [Google Scholar]
- Verhoeff, A. P., Min, M., Acke, B., et al. 2010, A&A, 516, A48 [NASA ADS] [CrossRef] [EDP Sciences] [Google Scholar]
- Woitke, P., Kamp, I., & Thi, W.-F. 2009, A&A, 501, 383 [NASA ADS] [CrossRef] [EDP Sciences] [Google Scholar]
- Woitke, P., Riaz, B., Duchêne, G., et al. 2011, A&A, 534, A44 [NASA ADS] [CrossRef] [EDP Sciences] [Google Scholar]
- Woitke, P., Min, M., Pinte, C., et al. 2016, A&A, in press, DOI: 10.1051/0004-6361/201526538 [Google Scholar]
All Tables
All Figures
|
Fig. 1 Line fluxes and luminosities from the central star versus effective temperature for the Spitzer 12.407 μm blend. The blue dots are the line fluxes of the models for the different central stars. The stars indicate the luminosities in the different wavelength bands. Detection limits for Spitzer IRS observations towards the same central star disks are plotted as thick green dashes (see Appendix A). Light green curve shows a fit to the sensitivity limits. The central stars are labelled with the name reported in Col. 1 of Table 2. |
| In the text | |
|
Fig. 2 Line fluxes for Spitzer 12.407 μm blend versus LFUV (stars cyan) and LX (magenta exagons). |
| In the text | |
|
Fig. 3 Theoretical Spitzer SH/LH spectra (convolved at R = 600 and rebinned) for models with different central stars; full continuum subtracted spectrum, artificially shifted for all the models (top); zoom on the 12 μm region (middle); zoom on the 26.5 μm region (bottom). |
| In the text | |
|
Fig. 4 Rockline position for the disks around different central stars. The thick black line indicates the disk contour at the gas density of 5 × 103 cm-3 for all our disk models, and we consider it as delimitation of our disk, because the erosion happens at more then 4 disk scale heights. The different colour and line styles delimit the contours of the disk with Tdust = 1500 K assumed as sublimation temperature of silicates. Upward and inward of this contour, the dust is sublimated, and the disk is truncated. It describes the effective extension of the disk according to the dust sublimation temperature. For late type stars, disk temperatures are too low, and the contour is replaced by a vertical line that indicates the distance from which the dust in thermal equilibrium should be photoevaporated. The position of the central star is indicated by the star symbol. |
| In the text | |
|
Fig. 5 Continuum-subtracted theoretical Spitzer spectra for Rin variation, artificially shifted, convolved at the resolution of R = 600, and rebinned. The second plot is a zoom of the complete spectrum for the 12 μm region. The third plot is a zoom on the 26.5 μm region. |
| In the text | |
|
Fig. 6 Continuum-subtracted theoretical Spitzer spectra for H0 variation, artificially shifted, convolved at the resolution of R = 600, and rebinned. The second plot is a zoom of the complete spectrum on the 12 μm region. The third plot is a zoom on the 26.5 μm region. |
| In the text | |
|
Fig. 7 Herbig parameter space for the water line blend at 15.17 μm. In the plot the data points (all upper limits, in grey) are from Pontoppidan et al. (2010a). All the fluxes are scaled to 140 pc. The shaded yellow area contains the range of sensitivity we retrieved from the Spitzer spectra of Herbig stars HD 135344B and HD 100546. All the fluxes of the disks considered are scaled to 140 pc. The trend toward disks being flatter than β = 0.8 is shown with a black arrow, since models that are too flat will be self-shadowed, and the derived mid-IR colour cannot be compared in a trustworthy manner with observations, in which the shadowing can be partial owing to a more complex disk structure. |
| In the text | |
|
Fig. 8 Theoretical Spitzer SH/LH spectra (R = 600) for models with different central stars rebinned and noisy; full continuum-subtracted spectrum, artificially shifted for all the models (top), zoom on the 12 μm region (middle), zoom on the 26.5 μm region (bottom). |
| In the text | |
|
Fig. 9 Theoretical spectra convolved and re-binned at different resolutions (Spitzer, IRS, R = 600; JWST MIRI, R = 3000 at 5.5 μm; VLT VISIR, R = 25 000), and zoom in the 26 μm region. The ranges adopted are the same as the instruments spectrographs. VISIR is ground-based, and the main limits are due to atmospheric transmission: we plotted only the region in which the transmissivity is ≥80%. The Spitzer spectrum with noise is also plotted in magenta. The strong feature at 12.93 μm in the VISIR modelled spectrum of a T Tauri star disk is due to H2 (J = 7−6, v = 0). Water lines contributing to the blends at 26 μm are indicated by vertical red arrows. |
| In the text | |
|
Fig. 10 p-H2O 2.394 μm ro-vibrational line prediction from models with a different central star. Typical sensitivity limits from the observations in Fedele et al. (2011; 10–40 min exposure) are shown as a red dashed line. |
| In the text | |
|
Fig. 11 Noise level versus continuum flux at the wavelengths of 12.407 μm (blue dots) and 15.17 μm (red squares). Overplotted are the fit to the data, green for 12.407 μm and magenta for the 15.17 μm. |
| In the text | |
|
Fig. C.1 Far-UV component for each of the stars we modelled. The black line is the best fit of the multiple epochs of observations. Spectra data points are colour-coded, and the original files are labelled. |
| In the text | |
|
Fig. C.1 continued. |
| In the text | |
Current usage metrics show cumulative count of Article Views (full-text article views including HTML views, PDF and ePub downloads, according to the available data) and Abstracts Views on Vision4Press platform.
Data correspond to usage on the plateform after 2015. The current usage metrics is available 48-96 hours after online publication and is updated daily on week days.
Initial download of the metrics may take a while.