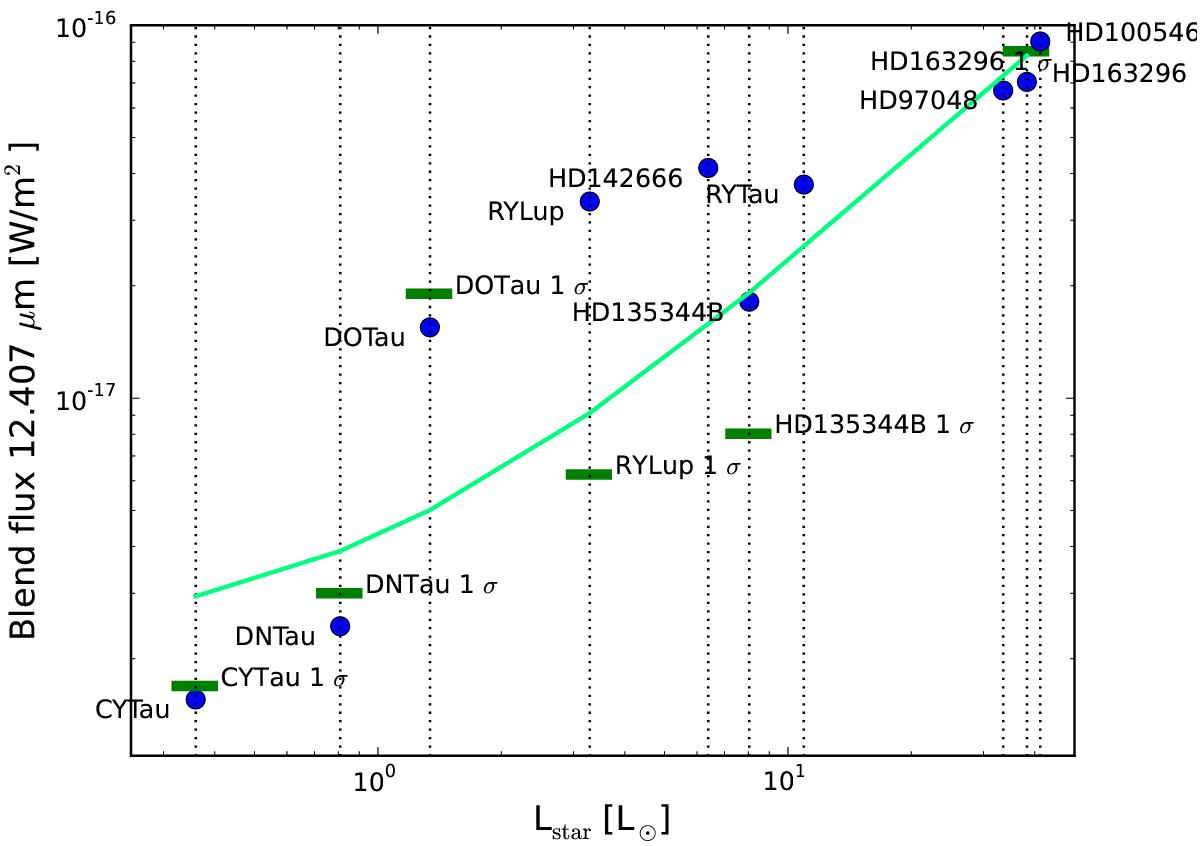
Fig. 1
Line fluxes and luminosities from the central star versus effective temperature for the Spitzer 12.407 μm blend. The blue dots are the line fluxes of the models for the different central stars. The stars indicate the luminosities in the different wavelength bands. Detection limits for Spitzer IRS observations towards the same central star disks are plotted as thick green dashes (see Appendix A). Light green curve shows a fit to the sensitivity limits. The central stars are labelled with the name reported in Col. 1 of Table 2.
Current usage metrics show cumulative count of Article Views (full-text article views including HTML views, PDF and ePub downloads, according to the available data) and Abstracts Views on Vision4Press platform.
Data correspond to usage on the plateform after 2015. The current usage metrics is available 48-96 hours after online publication and is updated daily on week days.
Initial download of the metrics may take a while.