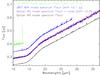
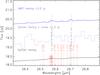
Fig. 9
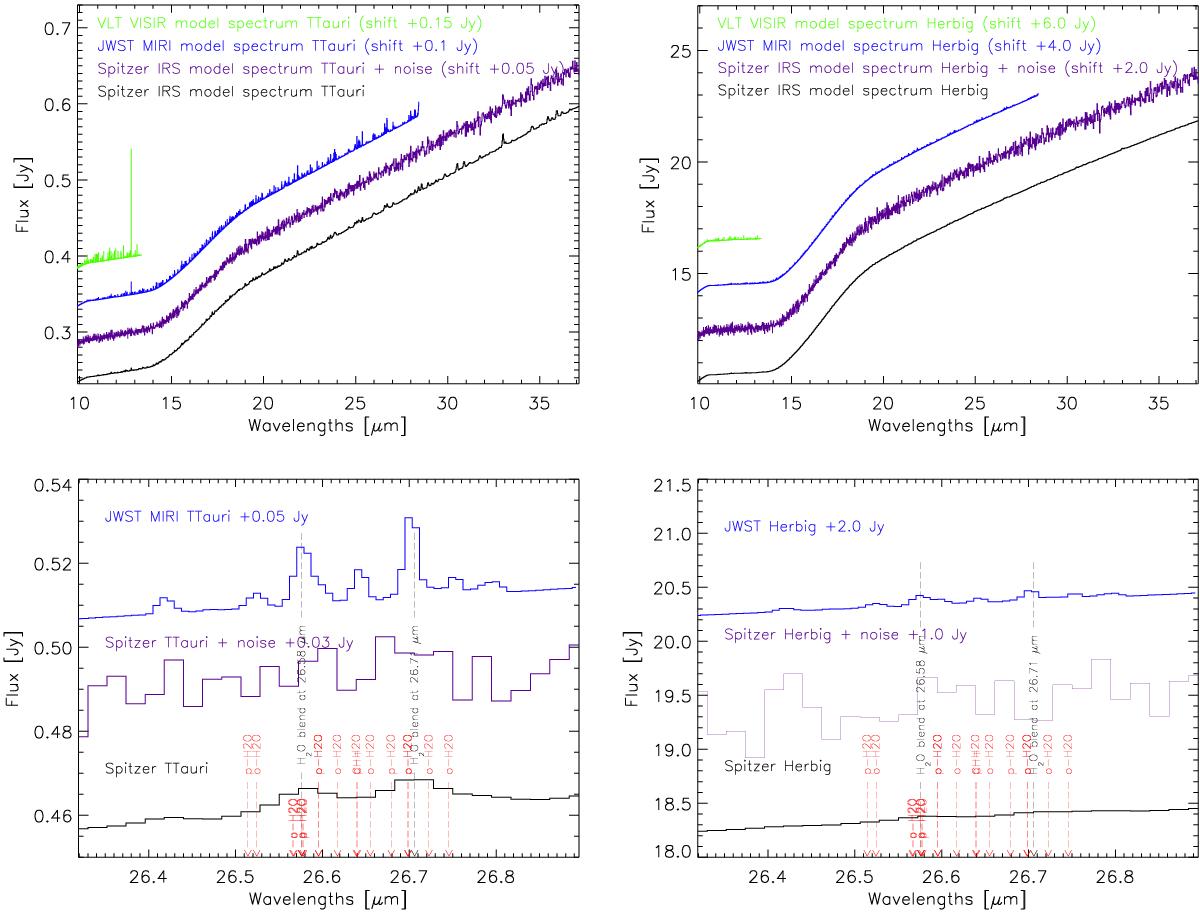
Theoretical spectra convolved and re-binned at different resolutions (Spitzer, IRS, R = 600; JWST MIRI, R = 3000 at 5.5 μm; VLT VISIR, R = 25 000), and zoom in the 26 μm region. The ranges adopted are the same as the instruments spectrographs. VISIR is ground-based, and the main limits are due to atmospheric transmission: we plotted only the region in which the transmissivity is ≥80%. The Spitzer spectrum with noise is also plotted in magenta. The strong feature at 12.93 μm in the VISIR modelled spectrum of a T Tauri star disk is due to H2 (J = 7−6, v = 0). Water lines contributing to the blends at 26 μm are indicated by vertical red arrows.
Current usage metrics show cumulative count of Article Views (full-text article views including HTML views, PDF and ePub downloads, according to the available data) and Abstracts Views on Vision4Press platform.
Data correspond to usage on the plateform after 2015. The current usage metrics is available 48-96 hours after online publication and is updated daily on week days.
Initial download of the metrics may take a while.