Free Access
Fig. 10
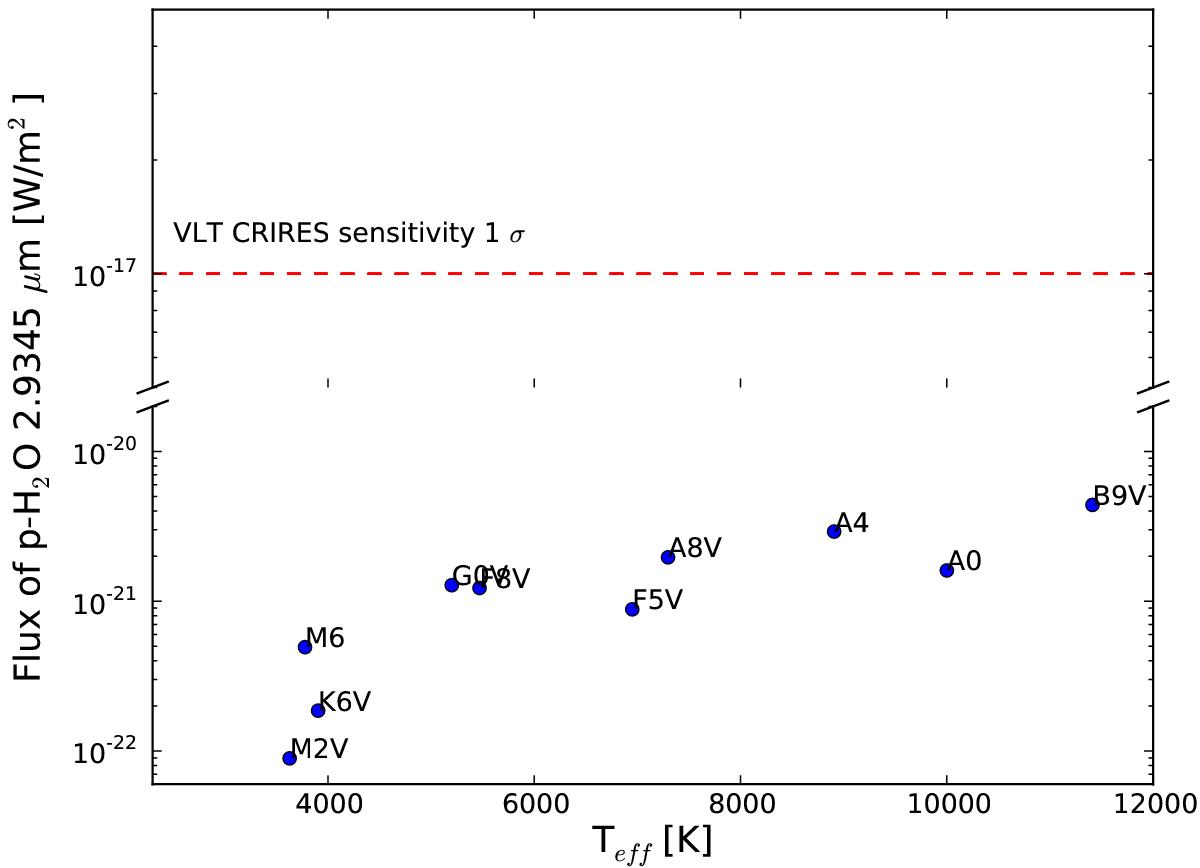
p-H2O 2.394 μm ro-vibrational line prediction from models with a different central star. Typical sensitivity limits from the observations in Fedele et al. (2011; 10–40 min exposure) are shown as a red dashed line.
Current usage metrics show cumulative count of Article Views (full-text article views including HTML views, PDF and ePub downloads, according to the available data) and Abstracts Views on Vision4Press platform.
Data correspond to usage on the plateform after 2015. The current usage metrics is available 48-96 hours after online publication and is updated daily on week days.
Initial download of the metrics may take a while.